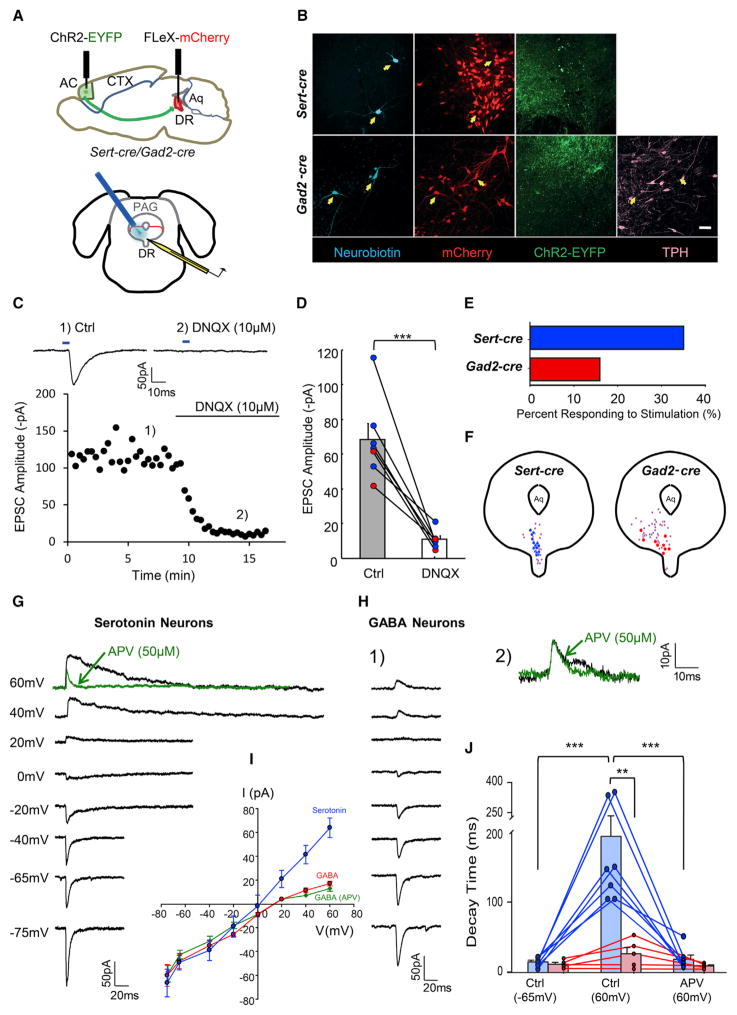
Figure 6. Connectivity and Synaptic Properties of Cortical Inputs to DR Serotonin and GABA Neurons.
(A) Schematic drawing of virus injection and slice recording procedures. Top, sagittal view showing AAVDJ-CaMKII-ChR2(H134R)-EYFP injection into anterior cortex (AC) of either Sert-cre (n = 6) or Gad2-cre (n = 5) mice. AAVDJ-EF1a-FLEx-mCherry was injected into the DR to label serotonin or GABA neurons. Bottom, whole-cell recording from mCherry+ cells in coronal sections containing the DR coupled with the laser stimulation from an optical fiber placed immediately above the DR.
(B) Confocal z projections showing recorded DR serotonin (upper panels) and GABA (lower panels) neurons filled with neurobiotin during recording (cyan) together with mCherry (red) and axon terminals from ChR2-EYFP-expressing anterior cortical neurons (green). Arrows point to neurobiotin-labeled neurons within the area covered by ChR2-EYFP+ axonal terminals. All are mCherry+. Gad2-cre slices were stained with Tph2 antibody (pink); all neurobiotin-labeled neurons were negative for Tph2. Scale, 50 μm.
(C) EPSCs evoked by photostimulation (blue bar, 5 ms) are mediated by AMPA receptors. Stimulation-induced EPSCs (C1) were abolished by application of DNQX (C2), an AMPA receptor antagonist. Top traces are the average of six trials from the same serotonin neuron, with 20 s intertrial intervals. Bottom graph shows the change in EPSC amplitude over time. Each dot represents an EPSC generated by optical stimulation at fixed 20 s intervals.
(D) Summary data showing that the amplitudes of light-evoked EPSCs are almost completely abolished by the application of DNQX. Blue dots, serotonin neurons. Red dots, GABA neurons. Paired t test, n = 7 cells.
(E) Connectivity rate of anterior cortical input to DR serotonin (blue) and GABA neurons (red).
(F) Summary diagram showing the locations of recorded DR serotonin (blue, left) and GABA neurons (red, right). Purple, nonresponding cells. Aq, aqueduct.
(G) EPSCs of a DR serotonin neuron at different membrane potentials. APV application abolished the slow (NMDA receptor) component at +60mV (inset, green trace). Each trace is an average of six repeats.
(H) (H1) EPSCs of a DR GABA neuron at different membrane potentials. (H2) APV application had minimal effect on the EPSC at +60mV (inset, green trace). Each trace is an average of six repeats.
(I) I/V curves of serotonin (blue, n = 7) and GABA neurons with (green, n = 5) or without (red, n = 5) APV in the recording solution.
(J) Decay time of photostimulation-evoked EPSCs. For serotonin neurons (blue), decay time of EPSCs significantly increased at +60mV compared to −65mV and was dramatically reduced by APV application. Paired t test, n = 7 cells. For GABA neurons (red), little difference was seen between EPSCs recorded at −65mV, +60mV, or with APV application.
Figure S6 provides evidence that connections between anterior cortical axons and DR serotonin and GABA neurons are monosynaptic.

