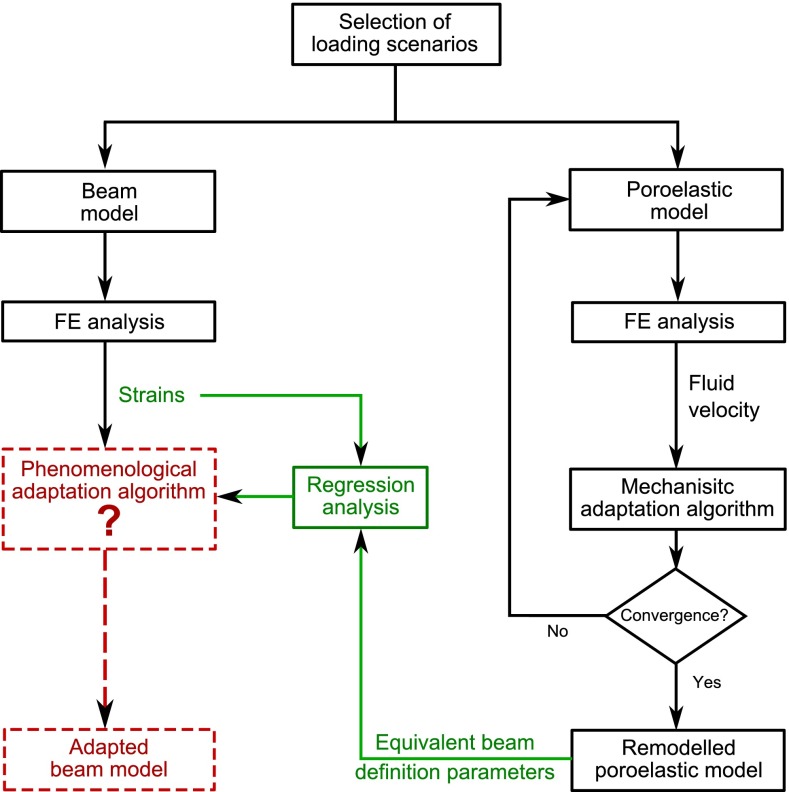
Fig. 1.
Flow chart of the study. In black are the simulation steps performed in this study. In dashed red are the simulation steps which will be made possible by the results of this study. In green are the analysis steps performed in this study, which will inform the red simulation steps, based on the results of the black simulations steps

