Figure 5.

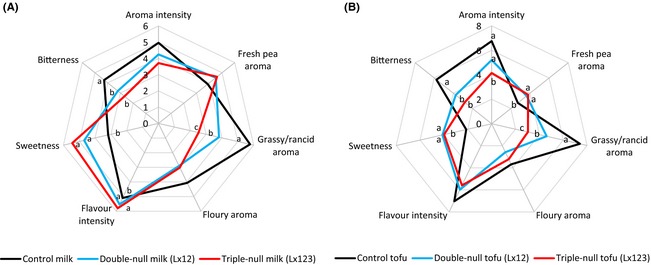
Plot of sensory scores for soymilk (A) and silken tofu (B) samples. n = 3 × 11, for each sensory attribute, the scores with a different letter are significantly different (P < 0.05).

Plot of sensory scores for soymilk (A) and silken tofu (B) samples. n = 3 × 11, for each sensory attribute, the scores with a different letter are significantly different (P < 0.05).