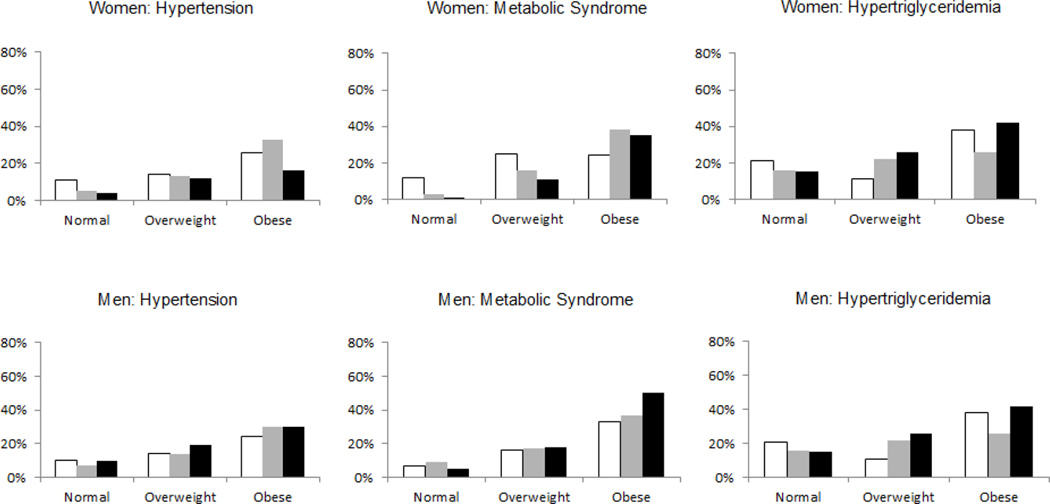
Figure 2. Sex-specific incidence of risk factors stratified by SAT attenuation tertiles within BMI Categories.
Normal weight defined as BMI < 25 kg/m2, overweight defined as BMI 25 to < 30 kg/m2, obese defined as BMI ≥ 30 kg/m2. SAT attenuation tertiles depicted as white bars (lowest tertile, i.e. most negative attenuation), gray bars (middle tertile) or black bars (highest tertile, i.e. least negative attenuation). Due to exclusion of individuals with the outcome present at baseline, the study populations differed for each outcome. For hypertension, the study populations consisted of 361, 171 and 116 women and 205, 370 and 153 men in the normal, overweight and obese categories, respectively. For metabolic syndrome, the study populations were 389, 162 and 89 women and 222, 348 and 82 men in each successive BMI category. For hypertriglyceridemia, the study populations were 370, 165 and 115 women, and 187, 271 and 113 men in each successive BMI category.

