
Fig. 1.
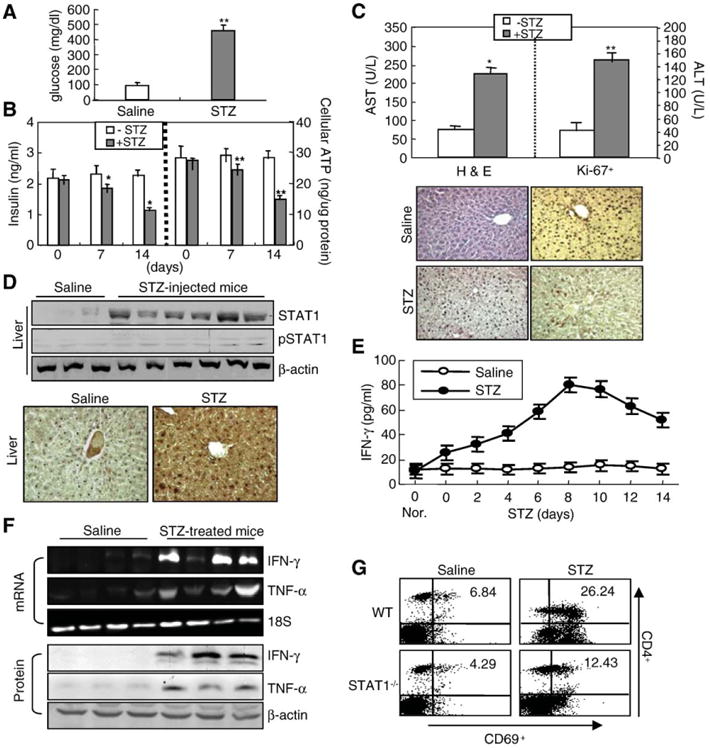
STZ administration induces diabetic liver injury and IFN-γ/STAT1 expression. Control and STZ-treated mice were described in “Materials and methods”. (A) Plasma glucose levels. (B) Insulin and ATP levels were measured. *P<0.01, **P<0.05 in comparison with corresponding STZ-non-treated control groups (0 day). (C) Upper panel: Serum AST and ALT levels. Lower panel: Representative H&E staining and Ki-67 immunostaining of livers from control and STZ-treated mice (×100). (D) Expression of STAT1 and pSTAT1 in the liver (upper, multiple samples in each group). Immunohistochemistry analyses (lower). Enhanced diffuse STAT1 immunostaining (dark brown) was detected (×100). (E) IFN-γ levels were measured by ELISA. After injection of STZ for 5 days, mice were sacrificed at the indicated time points. Values are shown as means±S.E.M. from four mice. (F) Expression of IFN-γ and TNF-α mRNA and protein in the liver analyzed by RT-PCR (upper) and Western blot analyses (lower), respectively. (G) After wild-type and STAT1−/− mice were injected with STZ, spleen lymphocytes were isolated. The surface markers CD4+CD69+ were analyzed by flow cytometry. Representative data are shown. (For interpretation of the references to colour in this figure legend, the reader is referred to the web version of this article.)