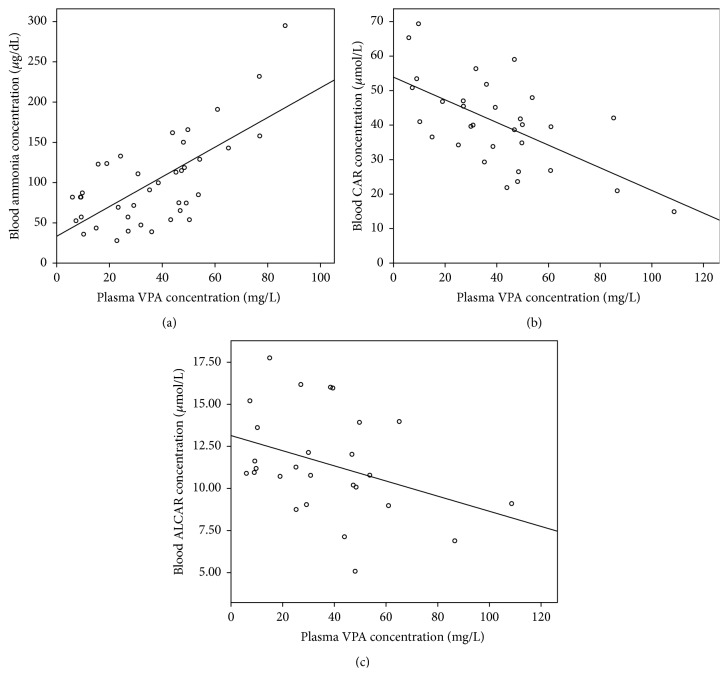
Figure 1.
Relationship between plasma VPA concentration and (a) blood ammonia concentration (y = 1.84x + 33.41, R 2 = 0.467, and p < 0.025); (b) blood CAR concentration (y = −0.328x + 53.90, R 2 = 0.380, and p < 0.0001) and (c) blood ALCAR concentration (y = −0.045x + 13.14, R 2 = 0.133, and p = 0.062).

