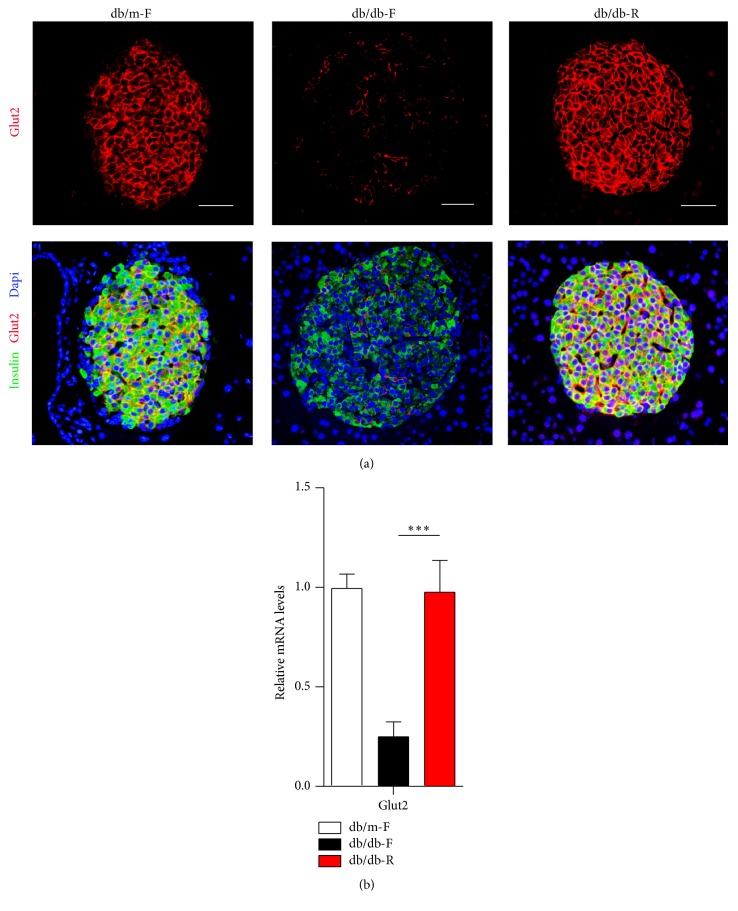
Figure 4.
(a) Immunofluorescence analysis of Glut2 and insulin expression in islet cells in db/m-F, db/db-F, and db/db-R mice. (b) Real-time PCR analysis of Glut2 expression in the islets in db/m-F, db/db-F, and db/db-R mice. ∗∗∗ P < 0.001. The data shown represent three independent experiments. db/db-F and db/db mice given free access to regular chow; db/db-R and db/db mice receiving restricted food supply; db/m-F and db/m mice given free access to regular chow. Scale bars: 25 μm.

