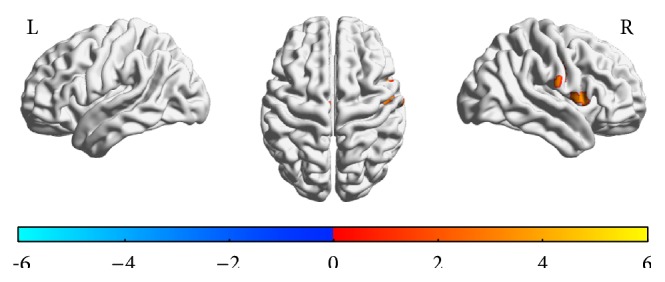
Figure 2.

Spatial distribution of associations between hemoglobin A1c and brain functional MRI activation during DSST performance in the scanner. Activation was also present in the dorsal cingulate gyrus (not shown). T maps of correlation analysis of hemoglobin A1c with task-related activity while performing the DSST in the scanner for the left (L) and right (R) hemisphere. The color bar indicates the direction of association: red-yellow for positive correlations (e.g., higher activation for higher HbA1c) and blue for negative correlations (e.g., higher activation for lower HbA1c). Threshold was at t = 1.71; voxelwise alpha < 0.001; AlphaSim corrected at p < 0.05. See Table 2 for list of regions.
