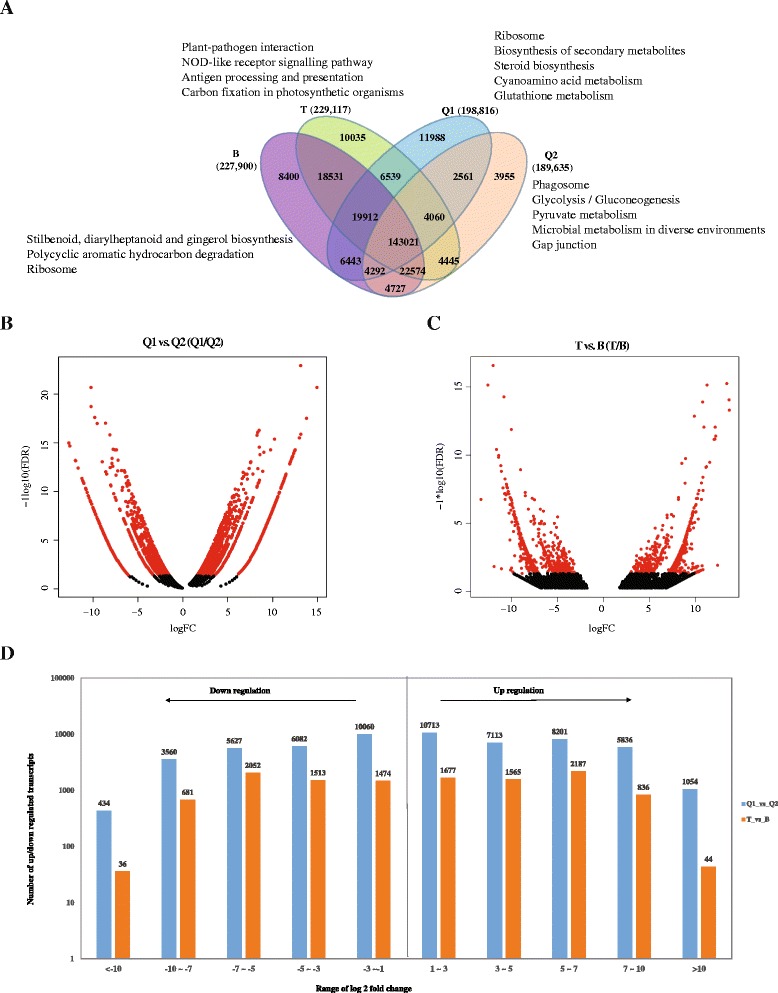
Fig. 3.

Transcriptome profile and different expression. a Venn diagram of transcripts detected in Q1, Q2, T and B. b Volcano plot of differentially expressed transcripts between Q1 and Q2. c Volcano plot of differentially expressed transcripts between T and B. d Numbers of up- and down-regulated transcripts identified in Q1 vs. Q2 and T vs. B
