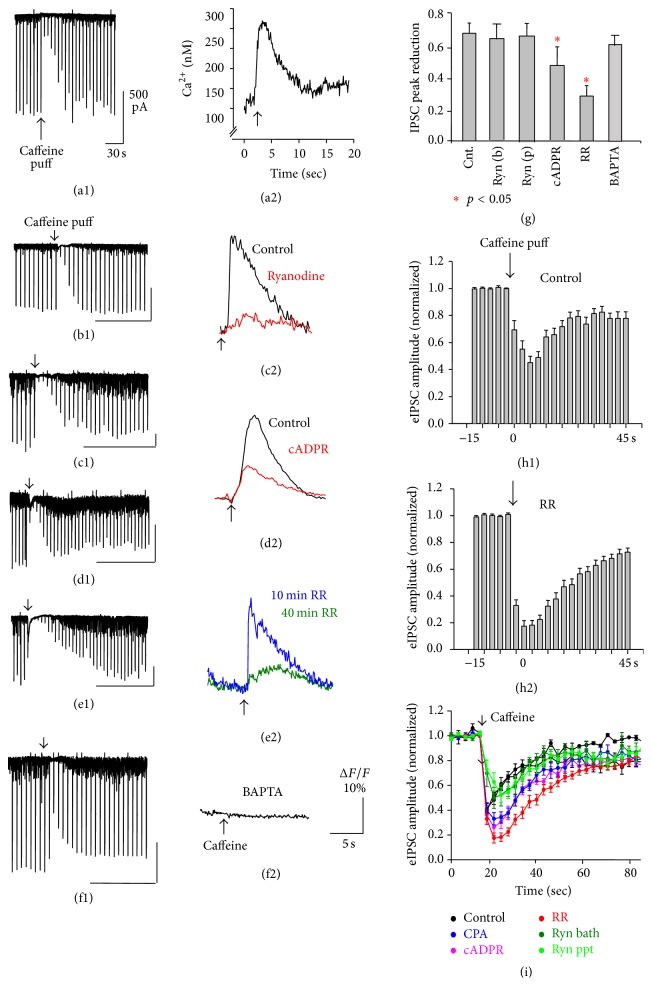
Figure 2.
Caffeine-induced suppression of GABAergic IPSCs (CSI) and concomitant increase in cytosolic calicum. Both measurements were recorded simultaneously from the same cell during the whole cell patch clamp recording. (a1 and b1) in control ACSF, (c1) in ryanodine in pipette, (d1) in cADPR in pipette, (e1) in ruthenium red (RR) in pipette, and (f1) with BAPTA (20 mM) in pipette. Caffeine was applied at the arrow. Reduction in IPSC peak amplitude is summarized in (g). Time-dependent changes in IPSC amplitude in control (h1) and ruthenium red (h2) (15 neurons each). Magnitude of CSI in response to control, CPA (cyclopiazonic acid, 30 μM), cADPR (10 μM), ruthenium red (20 μM), and ryanodine in pipette (100 μM) and in the bath (20 μM) (i). Calibrations in (b1, c1, d1, e1, and f1): 500 pA, 60 s. Calibration in (f2) is shared by (c2, d2, and e2).

