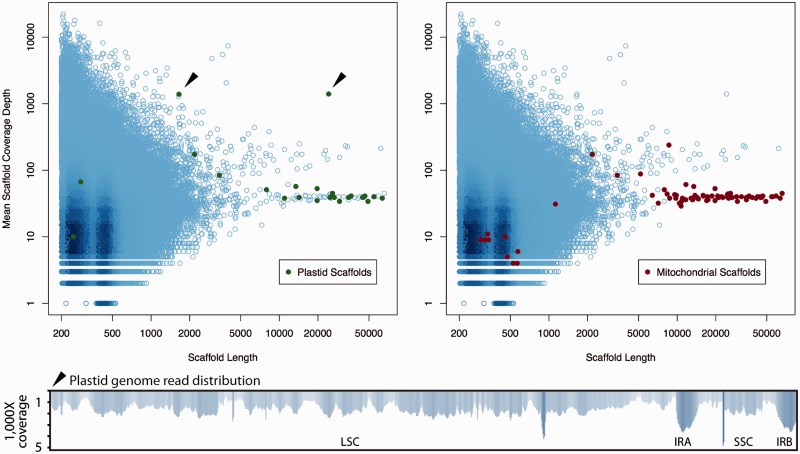
Fig. 2.—
Plot of read depths relative to scaffold length. Cyan circles are all scaffolds from the genomic assembly creating darker spots at greater read depths. Scaffolds containing BLAST hits to plastid genes are overplotted by green filled circles (left). Scaffolds containing BLAST hits to mitochondrial genes are overplotted by red filled circles (right). All scaffolds at around 40× coverage that contain plastid gene fragments also contain mitochondrial genes. This indicates plastid sequences that have migrated into the mitochondrial genome. The two green filled circles at around 1,400× coverage (filled black arrows) contain only plastid genes and comprise the Hydnora plastid genome. The remaining cyan circles correspond to the nuclear genome. The remaining red and green filled circles are presumably mitochondrial and plastid sequences that are located in the nucleus.

