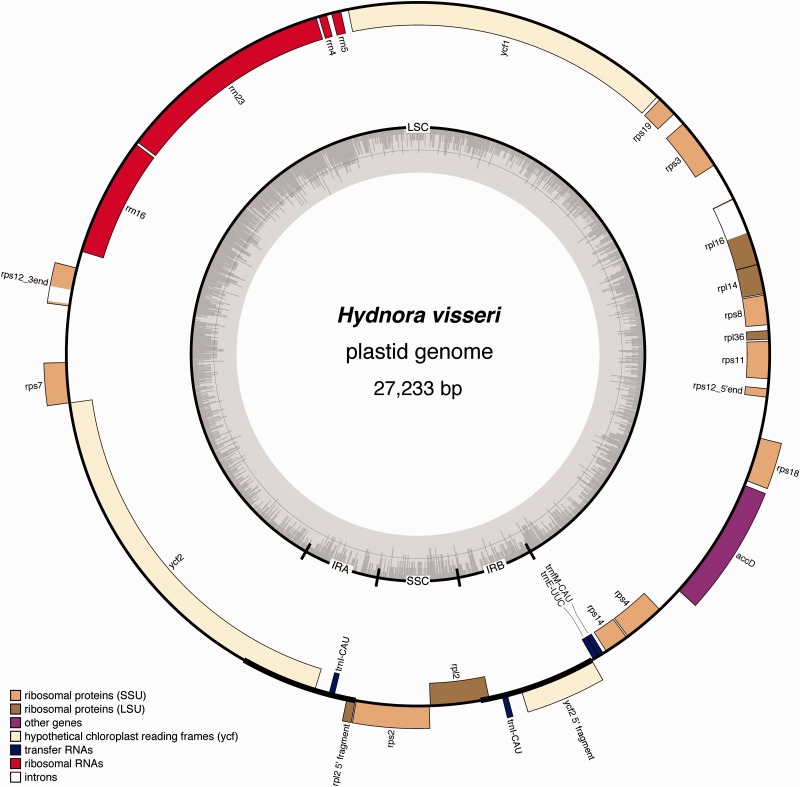
Fig. 4.—
Map of the plastid genome of Hydnora visseri. Genes are color coded according to the legend, which indicates functional groups. The inner ring illustrates the boundaries of the LSC and SSC regions, separated by the two copies of the inverted repeat (IRa, IRb). The innermost ring shows the GC content across the plastid genome.

