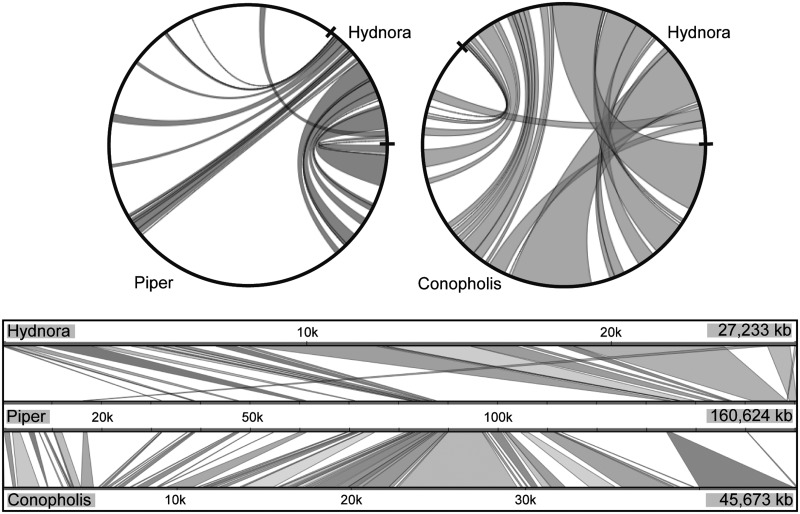
Fig. 5.—
Maps of plastid genomes showing colinearity. The two circles show annotation-based syntenic regions between Hydnora and Piper and, respectively, Hydnora and Conopholis (generated in mGSV, http://cas-bioinfo.cas.unt.edu/mgsv/, last accessed January 11, 2016). At the bottom, there is a comparison between all three species. Gene order is colinear with the exception of an inversion of a large gene block between Hydnora and Conopholis that originally stems from opposite IRs.

