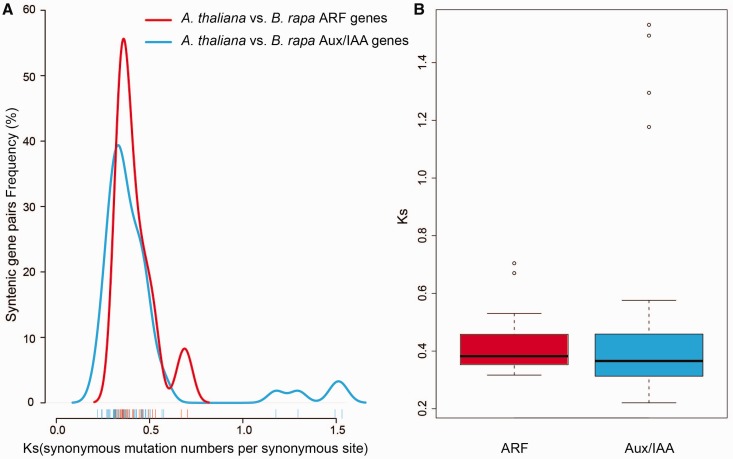
Fig. 2.
—Pairwise comparison of the Ks values for Aux/IAA and ARF homologous genes in Brassica rapa and Arabidopsis thaliana. (A) The distribution of the Ks values for Aux/IAA and ARF genes between Ar. thaliana and B. rapa. The lines representing the Aux/IAA and ARF genes are blue and red, respectively. (B) Box plot of the Ks values for the Aux/IAA and ARF genes between Ar. thaliana and B. rapa. Blue boxes indicate Aux/IAAs, and red boxes indicate ARFs.

