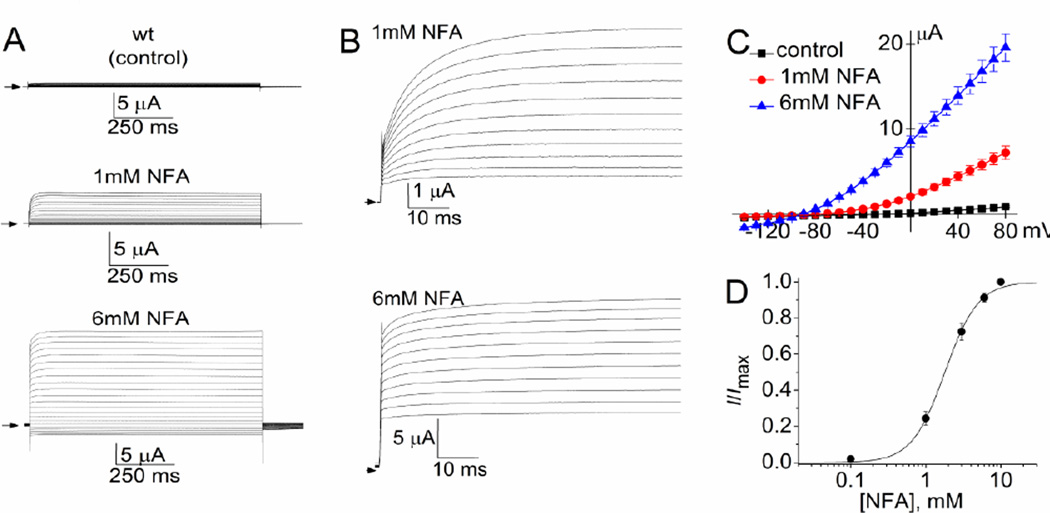
Fig. 1.
Activation of wt Slo2.1 channels by NFA. (A) Representative currents measured by TEVC in a Xenopus oocyte expressing wt Slo2.1 channels under control conditions and after achieving a steady-state increase in response to extracellular application of 1 and 6 mM NFA. Currents were measured in response to 1-s pulses to a Vt ranging from +80 mV to −140 mV, applied in 10 mV increments. Small arrows indicate 0 current level. (B) Expanded view of currents shown in panel A. The initial 75 ms for currents measured at a Vt ≥ −20 mV are shown. (C) Average I–Vt relationship for whole cell Slo2.1 channel currents measured in Xenopus oocytes (n = 14). (D) [NFA]-response relationships for wt Slo2.1 channels. The peak currents measured at 0 mV were normalized to peak response (I/Imax) and plotted as a function of [NFA]. The relationship was fitted with a logistic equation (smooth curve). EC50 was 2.2 ± 0.3 mM, and nH was 2.1 ± 0.2 (n = 11).

