Fig. 3.
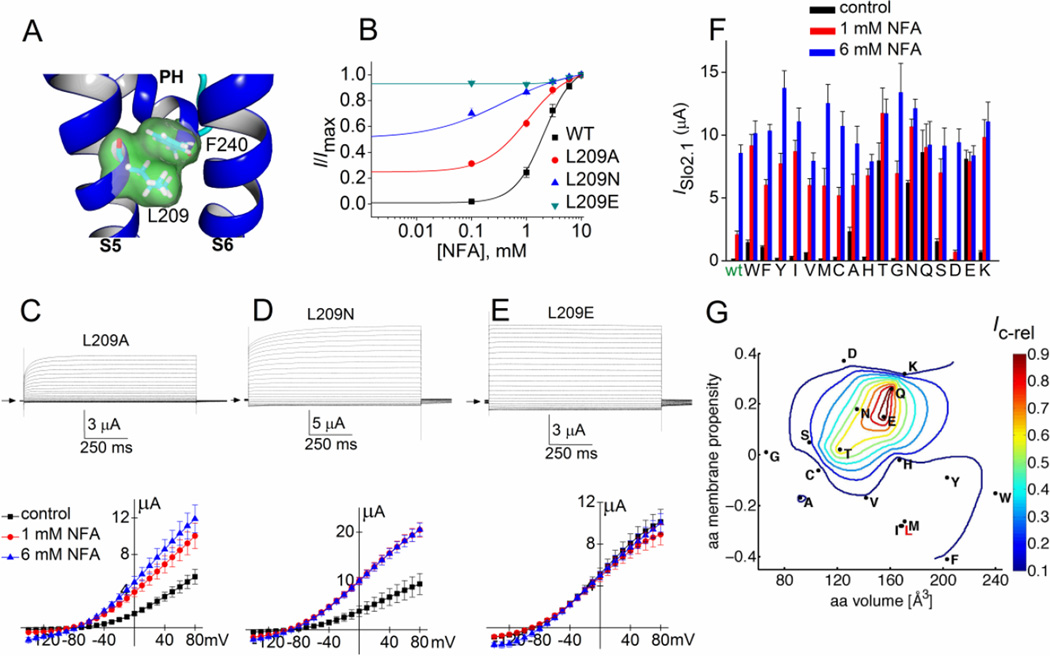
Point mutations of Leu-209 alter constitutive activity of Slo2.1 channels. (A) Slo2.2-based homology model of the S5-S6 region of a Slo2.1 subunit, highlighting the close proximity of Leu-209 in S5 and Phe-240 at the base of the pore helix (PH). (B) [NFA]-response relationships for wt (same data as in Fig. 1D) and three Leu-209 mutant channels. For L209A channels, EC50 = 1.4 ± 0.3 mM, nH = 1.6 ± 0.5 (n = 5). For L209N channels, EC50 = 0.28 ± 0.04 mM, nH = 0.60 ± 0.09 (n = 6). L209E channels do not respond to 1 or 6 mM NFA (n = 5), indicating that these mutant channels are maximally activated. (C–E) Representative currents (upper panels) recorded from individual oocytes expressing indicated mutant Slo2.1 channels under control conditions and I–Vt relationships (lower panels) for multiple oocytes before and after application of 1 and 6 mM NFA (L209A, n = 8; L209N, n = 5; L209E, n = 6). (F) Peak outward current measured at 0 mV in the absence (control) and presence of 1 and 6 mM NFA for channels containing Leu-209 substitutions as indicated on x-axis (n = 5–10). Amino acid substitutions are listed from left to right in order of decreasing hydrophobicity. (G) The variation in normalized constitutive current (Ic-rel) is contour plotted (z-axis) as a function of volume and membrane propensity of the residue substituted for Leu-209. The aa volume (x-axis) represents the average volume of a residue buried in a protein [1]. The amino acid membrane propensity (y-axis) is a knowledge-based hydropathy scale derived from an extensive transmembrane helix database and optimization algorithm described in detail by Punta and Maritan [4], where a negative value indicates a high membrane propensity. The native residue, Leu-209 (L) is indicated in red text. Error bars indicate ± S.E. (panels C–E) or + S.E. (panel F).

