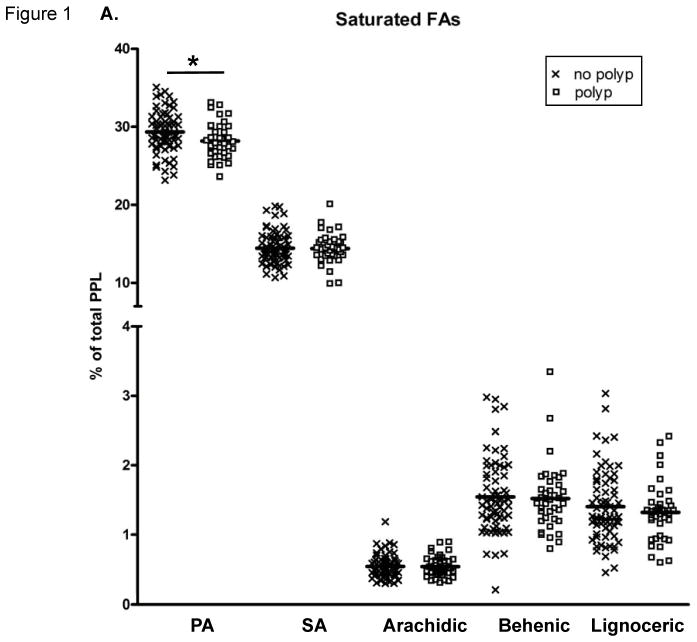
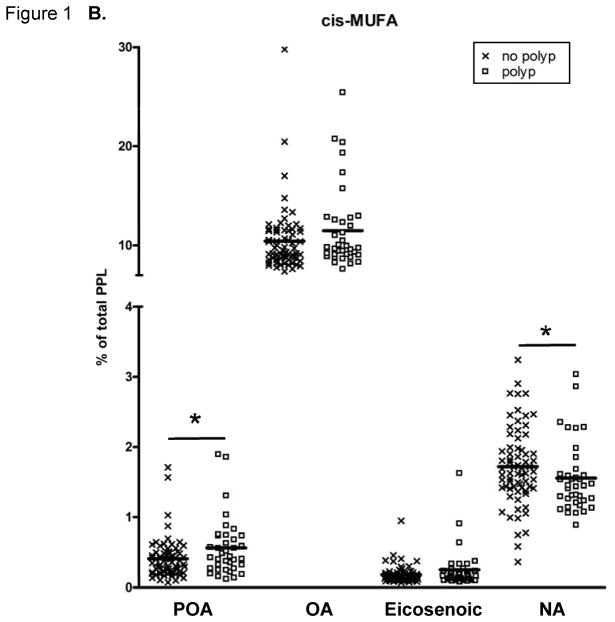
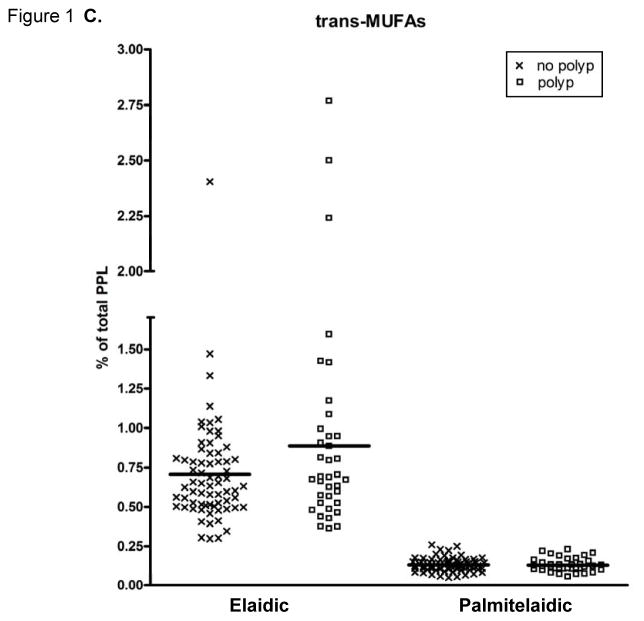
Figure 1.
Fatty acid (FA) content of plasma phospholipids (PPLs). (A) Saturated FAs (SatFAs), (B) cis-monounsaturated FAs (MUFAs), and (C) trans-MUFAs. The symbol “X” represents PPL FA levels of individuals with no polyps and “□” represents PPL FA levels of individuals with adenomas. The solid lines indicate the mean. FAs are expressed as a percent of total PPL FAs. A “*” indicates p ≤ 0.05, calculated by Wilcoxon-Mann-Whitney nonparametric U-test. NA, nervonic acid; OA, oleic acid; PA, palmitic acid; POA, palmitoleic acid; SA, stearic acid.


