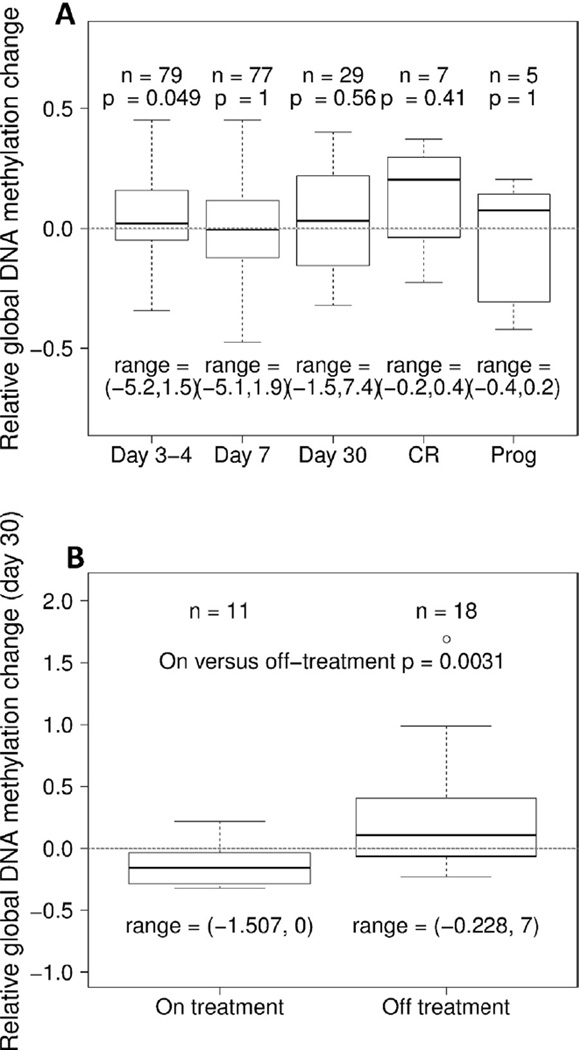
Fig. 1.
Global DNA methylation changes compared to prestudy samples. A Samples from the entire cohort. B Samples from around day 30, showing decreased global DNA methylation comparing those on treatment versus those off treatment. Box-plots show 25% and 75% values, and thick horizontal black lines indicate the median. Upper and lower whisker indicate the largest and smallest value data points not more or less than 75% + IQR and 25% − IQR, respectively. The range are printed below the boxplots to indicate the full scale of the data.

