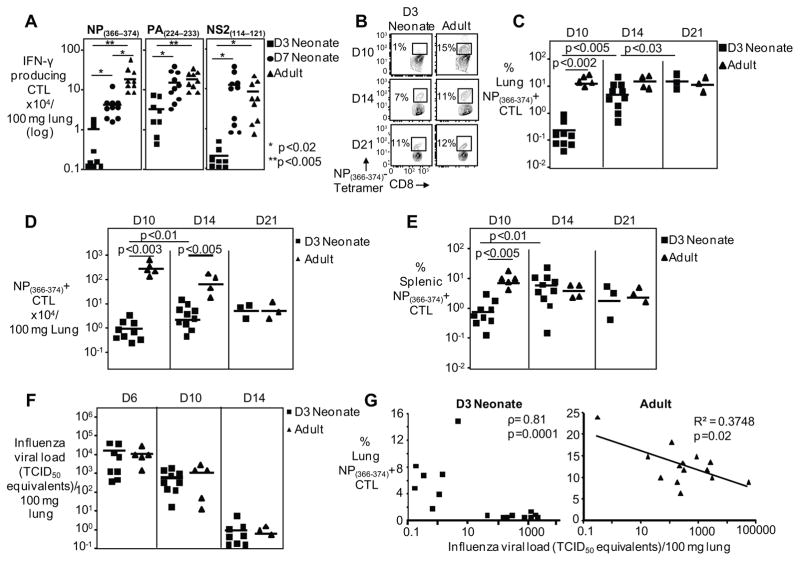
Figure 2. Diminished and delayed primary CD8+ T cell response in Influenza virus infected neonates.
(A) IFN-γ producing CTL numbers for the NP366–374, PA224–233 and NS2114–121 peptide stimulation of d10 post infection pulmonary lymphocytes are depicted. Symbols represent individual animals, with the horizontal line marking the mean of each group (n= 8–10 mice per group, 2 independent experiments). Representative flow cytometry plots (B) and pooled data (C) showing frequencies of pulmonary CTLs 10,14, and 21 days after PR8 infection. Symbols represent individual animals, horizontal line marking mean of each group (n= 3–10 mice per group, at least two independent experiments). (D) NP(366–374)-specific CTL numbers per 100 mg of lung shown from the lungs day 10,14, and 21 post-infection. (E) Percentage of splenic NP(366–374)-specific CTLs are shown day 10,14, and 21 post-infection. (F) Neonates have similar viral loads as compared to the adults during influenza infection. Viral loads were measured by real-time PCR and normalized per 100 mg of lung tissue. Symbols represent individual animals, horizontal line marking mean of each group (n= 3–9 mice per group, at least two independent experiments). (G) Viral load and NP(366–374)-specific CTL frequency inversely correlate in neonates and adults. Nonparametric (Spearman’s rho) statistics were used for measurements of correlation for data without a normal distribution (neonates) and a linear regression was performed for data with a normal distribution (adults). Each symbol depicts one animal (neonates=16, adults=14).

