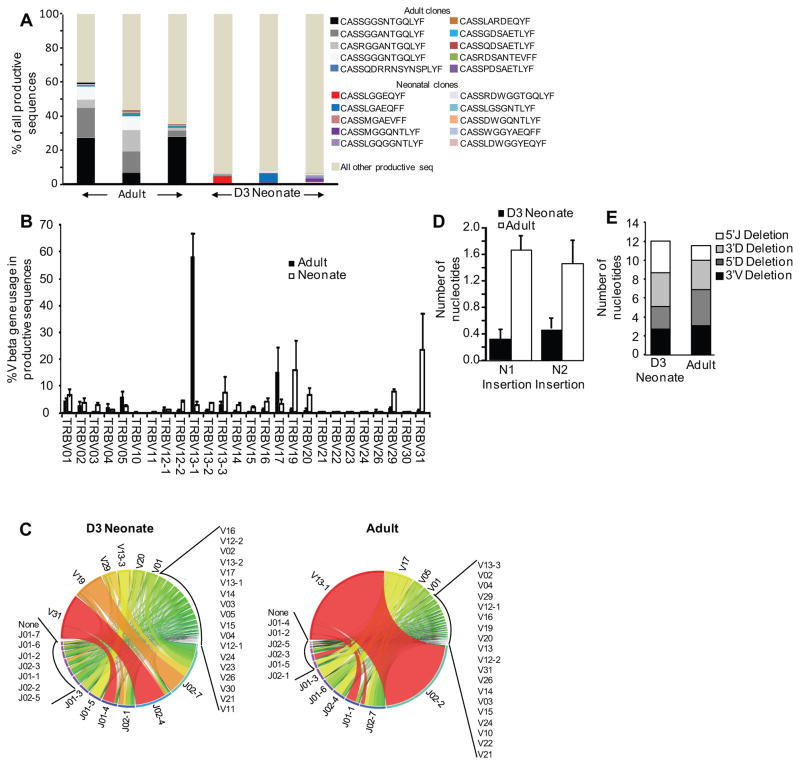
Figure 4. High-throughput sequencing of the neonatal versus adult mouse T cell receptor repertoire of virus-specific CTLs.
High-throughput sequencing was performed on sorted NP(366–374)- specific CTLs. (A) The CDR3 sequence frequency for all productive sequences for both the neonates and adults is shown, with the ten most common shared clones among the adults and neonates highlighted. (B) The percentage of total Vβ gene family usage (mean±SEM) of all productive sequences shown. (C) Circos plots of frequencies of Vβ and Jβ usage and combinations of productive sequences shown. The width of the band is proportional to the frequency. (D) The number of nucleotides inserted into the N1 (region between the V and J gene segments) and N2 (region between the J and D gene segments) are shown. (E) 3′V and 3′D trimming is the nucleotide loss at the 3′of the V and D gene segments, respectively; 5′J and 5′D trimming is the nucleotide loss at the 5′ of the J and D gene segments, respectively.

