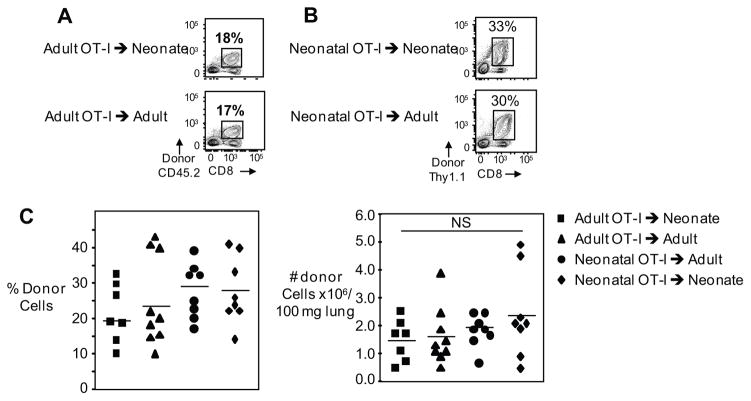
Figure 5. Expansion of neonatal and adult OT-I CD8+ T-cells after adoptive transfer into neonatal and adult mice is comparable.
Splenocytes from neonatal and adult mice were adoptively transferred into neonates or adults and the expansion of OT-I CD8+ cells were analyzed on day 7 post-infection. Representative flow cytometry plots of pulmonary lymphocytes depict percentage of adult (A) and neonatal (B) donor OT-I CD8+ T cells on day 7 post-infection. Pooled data showing percentage (C left) and numbers (C right) of pulmonary donor OT-I CTLs. Symbols represent individual animals, horizontal line marking mean of each group (n= 7–9 mice per group, two independent experiments). Statistical analysis was performed using the Shapiro-Wilk W test for normality, Student’s t-test for paired and unpaired samples.

