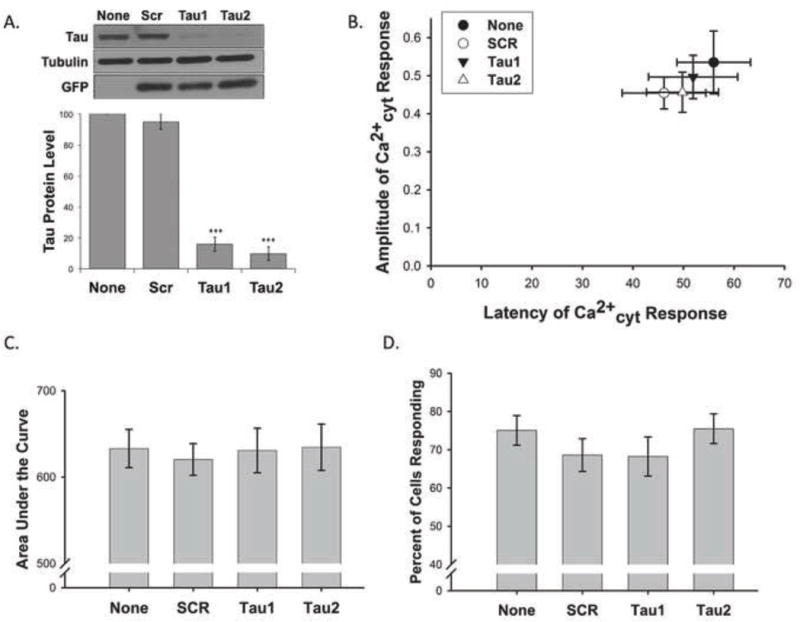
Figure 3. Tau knockdown does not facilitate KA-induced Ca2+ influx in primary rat cortical neurons.

Lentiviral knockdown of tau was optimized in rat primary cortical neurons. Tau protein expression was normalized to a loading control (β-actin or α-tubulin) and is presented as a percentage compared to the no virus (None) control (n = 19, *** indicates P<0.001) (A). Rat primary cortical neurons expressing lentiviral shRNA targeting rat tau (Tau1 and Tau2), an irrelevant scrambled control virus (SCR), or no virus were loaded with Fura2-PE3. The amplitude and latency of the first Ca2+cyt peak after addition of KA were compared to baseline values (0,0) (B). The area under the curve (C) was approximated for the entire interval in which 0.5μM KA was present. The percent of cells per field of view that demonstrated at least a 10% increase in Ca2+cyt fluorescence from baseline in response to 0.5μM KA was calculated (D). Data in B–D are presented as mean +/− SEM from 20 to 32 separate experiments.
