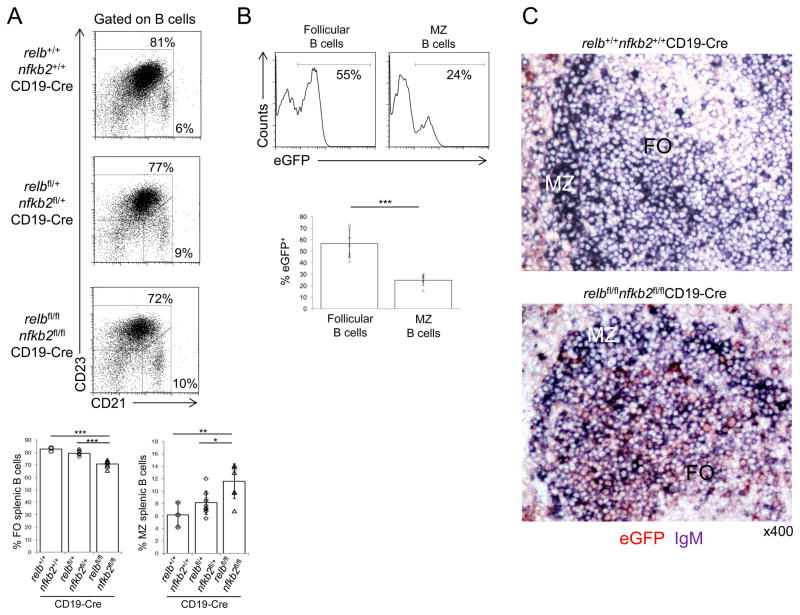
Figure 5. Counter selection against relb/nfkb2-deleted follicular and MZ B-cells in relbfl/flnfkb2fl/flCD19-Cre mice.
(A) CD21 and CD23 expression of splenic B cells from mice of the indicated genotypes were analyzed by flow cytometry. Numbers besides gates indicate the percentage of follicular (CD23+CD21int) and MZ (CD21hiCD23−) B-cells (top). Summary of the frequencies of follicular and MZ B-cells (bottom). Each symbol represents a mouse. Data are shown as mean ± standard deviation. Statistical significance was determined by one-way ANOVA (*, P<0.05; **, P<0.01; ***, P<0.001). (B) The fractions of eGFP+ cells among splenic follicular (CD23+CD21int) and MZ (CD21hiCD23−) B-cells in relbfl/flnfkb2fl/flCD19-Cre mice were determined by flow cytometry. Numbers above gates indicate the percentage of eGFP+ B-cells among the indicated B-cell subsets (top). Summary of the frequency of eGFP+ cells among the corresponding B-cell subsets (bottom). (C) Spleen sections from mice of the indicated genotypes were analyzed for the expression of eGFP and IgM by immunohistochemistry. FO, follicular area; MZ, marginal zone area. One representative mouse out of 3 per group is shown. 400x. Each symbol represents a mouse. Data are shown as mean ± standard deviation. Statistical significance was determined by Student’s t test (***, P<0.001).

