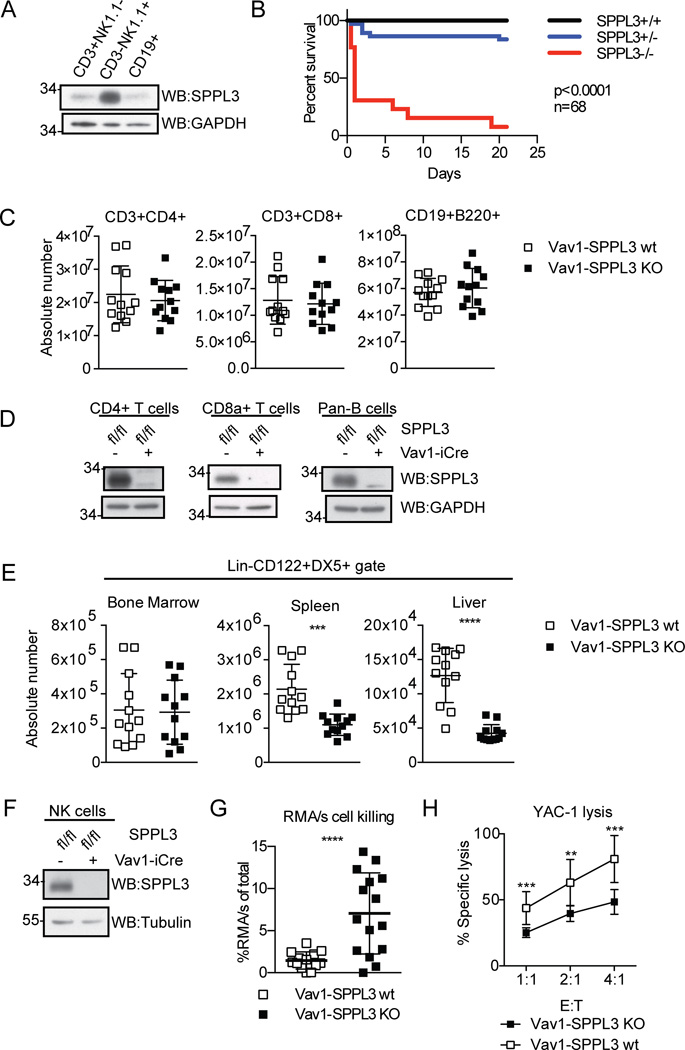
Figure 1.
SPPL3 is required in the immune system for normal NK cells. (A) Expression of SPPL3 in C57Bl/6J splenocytes sorted on the indicated markers. Representative panel from three independent experiments with one mouse per experiment. (B) Kaplan-Meier survival curve of nonconditional SPPL3 knock-out mice (n=68 pups, p value was calculated by Mantel-Cox test). (C) Absolute number of lymphocytes in the spleen. Pooled data from three experiments with n=3–4 mice per genotype. (D) SPPL3 expression in splenocytes isolated using the indicated Miltenyi negative isolation kits. Representative images from two independent experiments with n=1–2 mice per genotype. (E) Absolute number of NK cells (Lin−CD122+DX5+) in the indicated organs. Pooled data from four independent experiments with n=3–4 mice per genotype. (F) Western blot of splenic NK cells after negative isolation. Representative blot from four independent experiments with n=2–3 mice per genotype. (G) Percent RMA/s cells (of total RMA + RMA/s cells collected) remaining 48 hours after intraperitoneal injection. Pooled data from three independent experiments with n=2–8 mice per genotype. (H) Percent specific YAC-1 lysis after four-hour co-culture with isolated splenic NK cells (equivalent DX5+ cell number) at the indicated effector: target (E:T) ratios. Pooled data from three independent experiments with n=3 mice per genotype. For experiments in panels C, E, and G, each data point represents one mouse. **p<0.01, ***p<0.001, ****p<0.0001 (two-tailed unpaired Student’s t-test with Welch’s correction). For experiments in panel H, each data point represents the mean of three pooled experiments. The data was analyzed by unpaired Student’s t test, and statistical significance determined using the Holm-Sidak method, with alpha=5.000%. Each ratio was analyzed individually, without assuming a consistent SD.

