Figure 6.
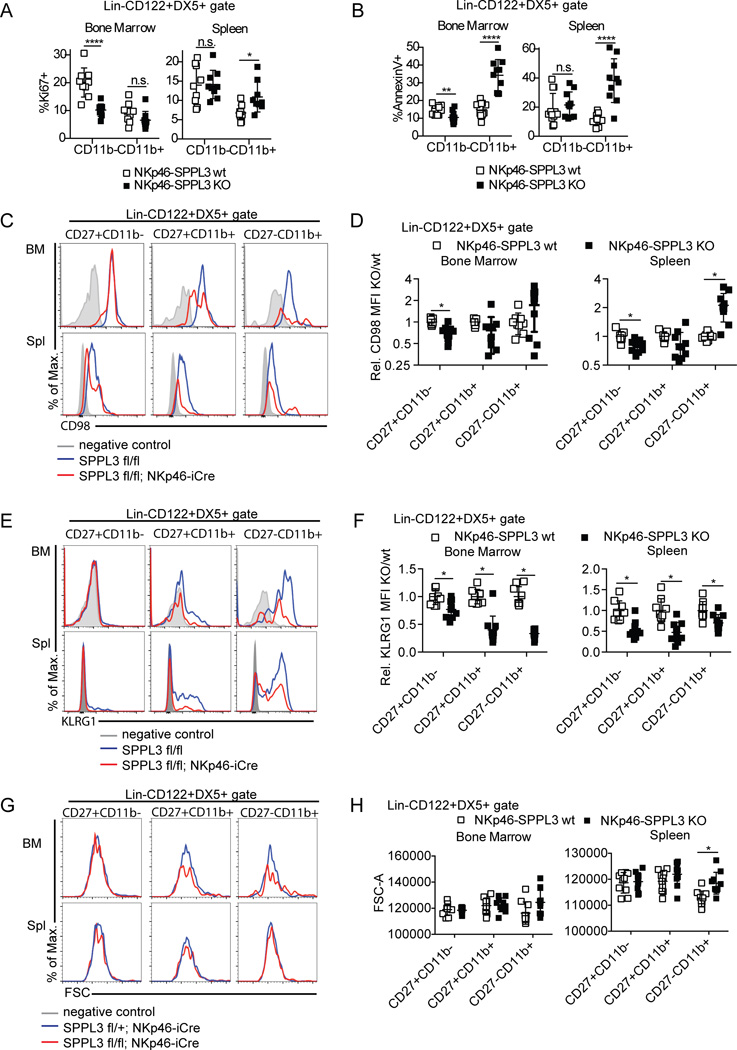
SPPL3 regulates NK cell proliferation and survival in vivo. (A) Percent Ki67+ NK cells (Lin−CD122+DX5+) in the spleen and bone marrow. Pooled data from three experiments with n=3 mice per genotype. (B) Annexin V staining of splenic and bone marrow NK cells. Pooled data from three independent experiments with n=3–4 mice per genotype. (C, E, G) Representative flow panels showing the expression of CD98 (C), KLRG1 (E), and forward scatter (FSC, G) on the indicated NK cell gates in each organ. (D, F, H) Mean fluorescensce intensity of CD98 (relative, D), KLRG1 (relative, F), and FSC (absolute, H) on NKp46-SPPL3 KO NK cells in spleen and bone marrow, as compared to NKp46-SPPL3 wt controls. Pooled data from three independent experiments with n=3–4 mice per genotype. Each data point represents one mouse. *p<0.05, ****p<0.0001 (unpaired Student’s t-test, statistical significance determined using the Holm-Sidak method, with alpha=5.000%. Each subset was analyzed individually, without assuming a consistent SD).

