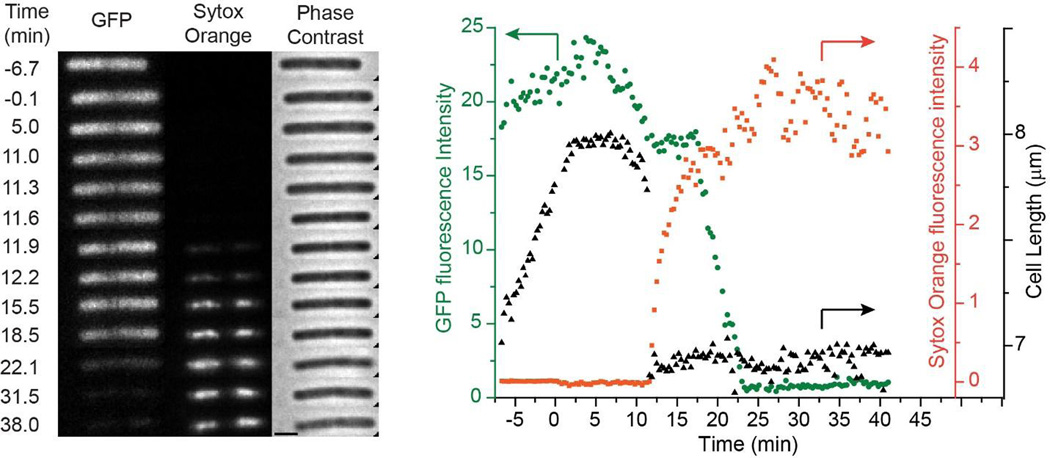
Figure 1.
Left: Three channel montage of images vs time for a single B. subtilis cell exposed to 16 µg/mL alamethicin (1X MIC) and 2 nM Sytox Orange beginning at t = 0. Fluorescence images of cytoplasmic GFP and Sytox Orange and phase contrast images were obtained at times shown. Scale bar is 2 µm. Right: For the same cell, plots of total GFP intensity (green circles), total Sytox Orange intensity (orange squares), and cell length (black triangles) vs time. Arrows point to the appropriate axis for each plot. Only one single cell was amenable to quantitative analysis.

