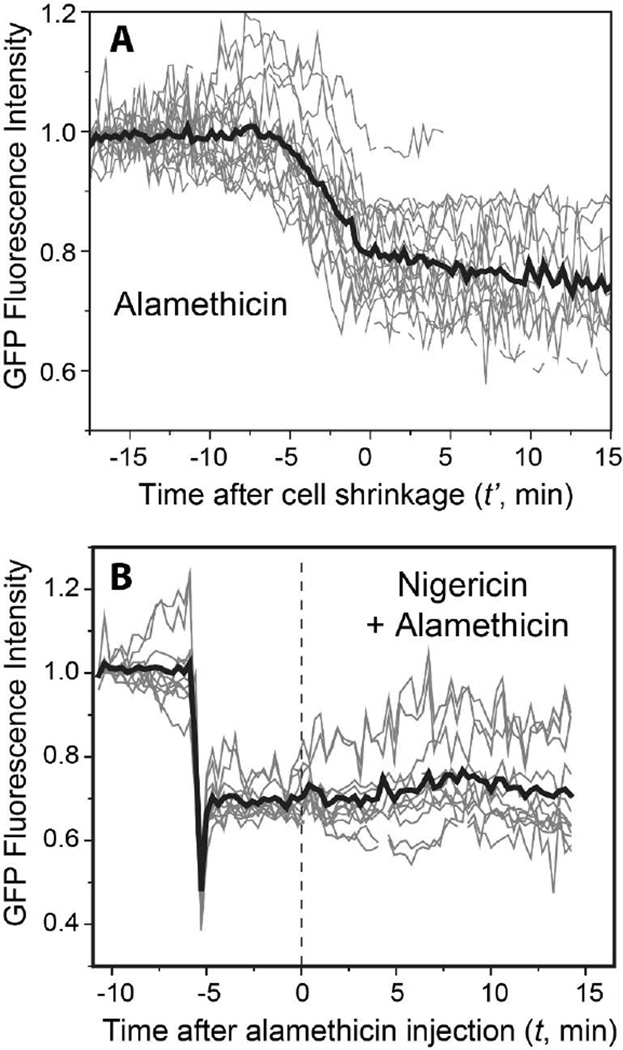
Figure 2.
(A) Normalized total GFP fluorescence intensity vs time for 19 cells exposed to 16 µg/mL alamethicin (thin gray lines). For phasing, this plot defines time t’ = 0 as the end of the abrupt cell shrinkage event. The average of all 19 traces is shown as the heavy black line. The time of alamethicin injection varies from t’ = –17.1 to –7.5 min. The average decrease in GFP intensity is 20%. (B) Normalized total GFP fluorescence intensity for 11 cells treated with 5 µM nigericin at t = –6 min. At t = 0 the flow was changed to 5 µM nigericin plus 16 µg/mL alamethicin. The average of all 11 traces is shown as the heavy black line. The nigericin-induced decrease in GFP intensity from plateau to plateau is ~30%.

