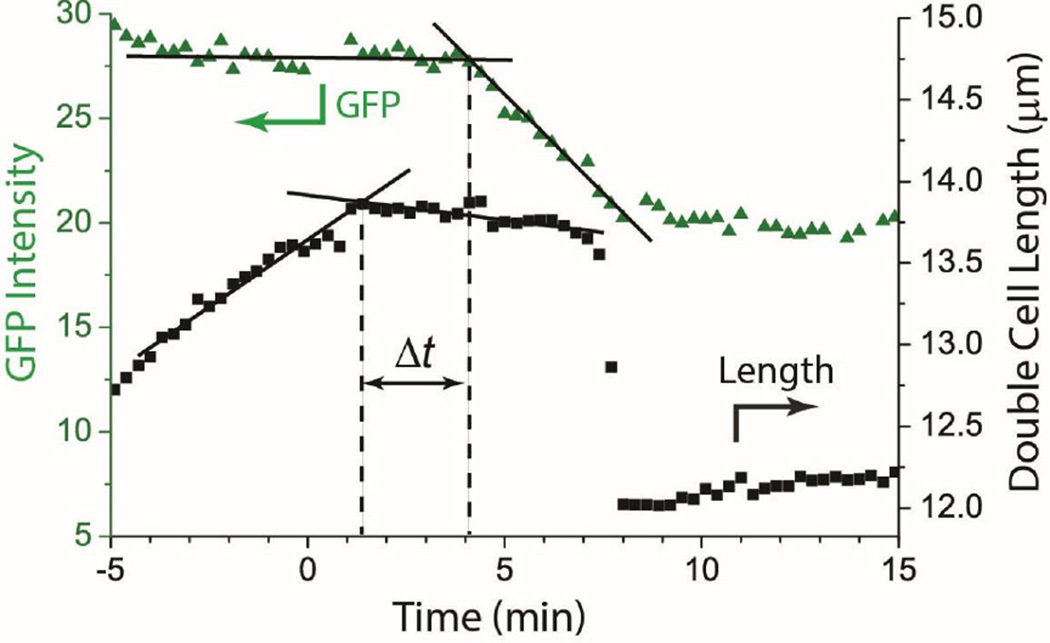
Figure 4.
Example of cell length and GFP intensity vs time plot for one double cell. Cell length flattens rather abruptly well before the GFP intensity begins to decrease. The construction shown is used to measure the lag time between the two events; Δt = 2.7 min in this case. See Fig. S4 for additional examples, one of which exhibits transitions that are less sharp in time.

