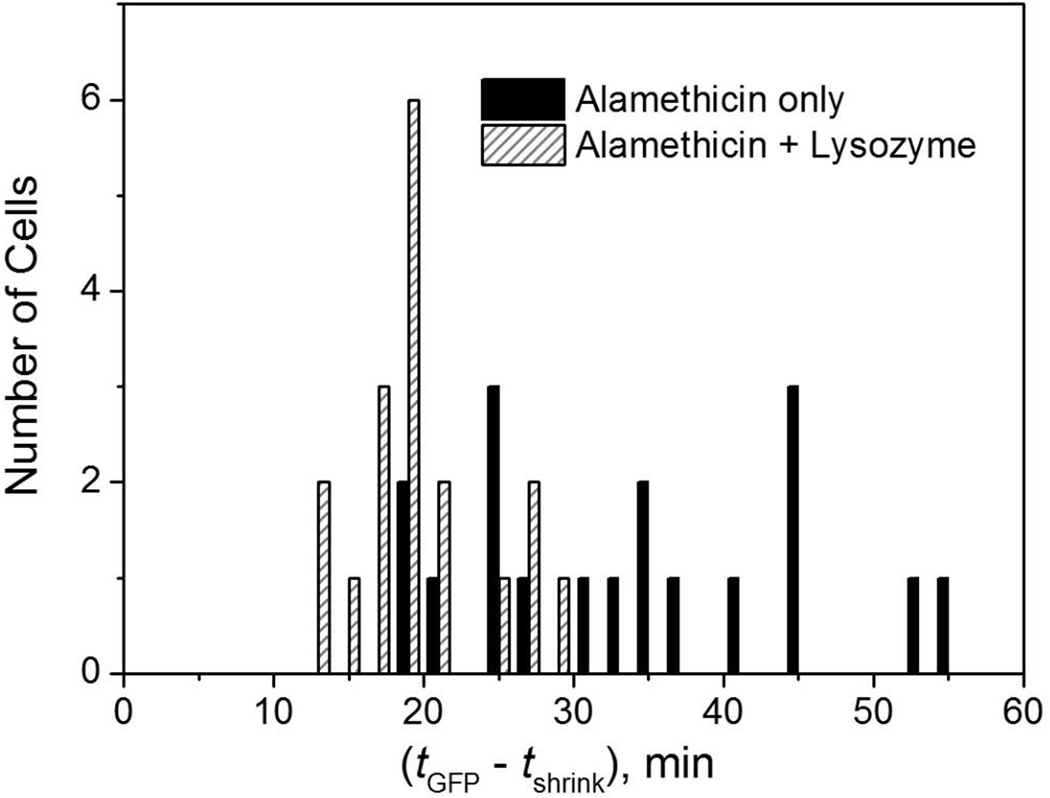
Figure 5.
Distribution of lag times between abrupt cell shrinkage and the onset of complete loss of GFP from the cell envelope. Black bars are for 18 cells exposed to 16 µg/mL alamethicin. Cross-hatched bars are for 17 cells exposed to 16 µg/mL alamethicin plus lysozyme at 0.2 µg/mL, with lysozyme added t = 5 min, after cell shrinkage had occurred. The mean value of (tGFP – tshrink) is 34 ± 11 min with alamethicin alone and 20 ± 5 min with alamethicin plus lysozyme (± 1 standard deviation).

