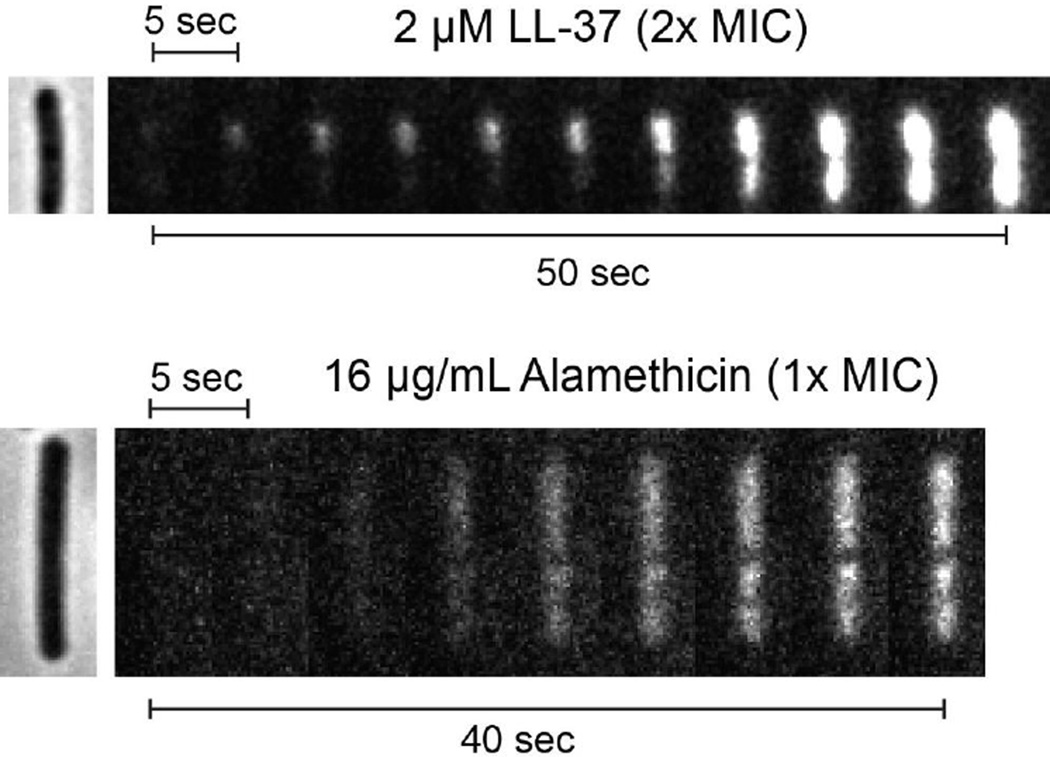
Figure 6.
Comparison of dynamics of nucleoid staining by Sytox Orange exposed to 2 µM LL-37 (top, 2X MIC) vs 16 µg/mL alamethicin (bottom, 1X MIC). A single phase contrast image was taken before the start of the Sytox Orange data acquisition, as shown at left. Data were taken at 0.5 sec/frame; every 10th frame is shown.

