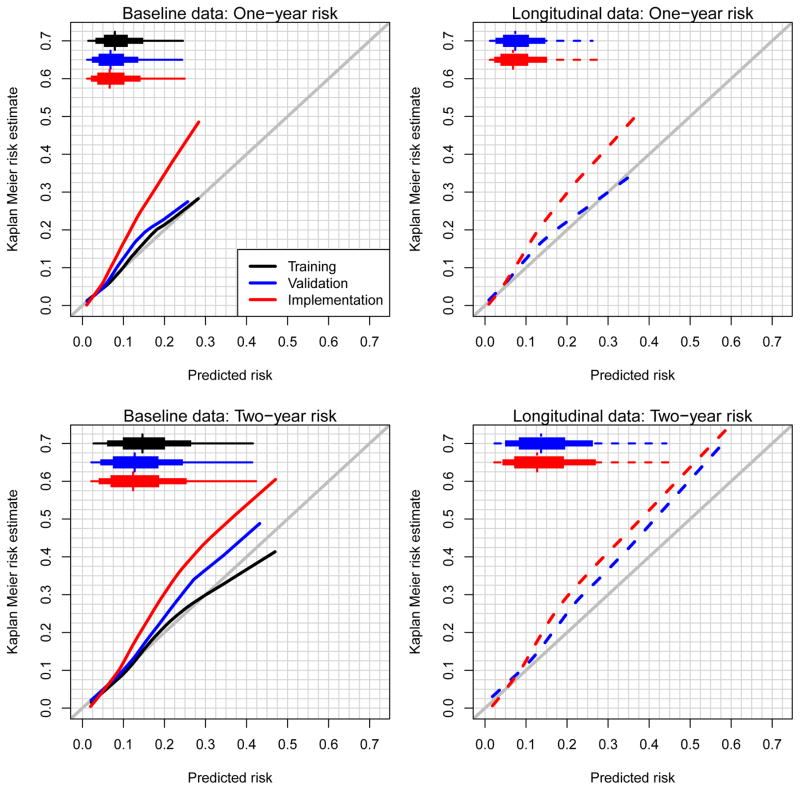
Figure 4.
Calibration plots for one- and two-year risk estimates. Estimates were calculated by applying the training set model to itself across bootstrap replicates and the resulting training set model to the validation and implementation datasets. Modified boxplots highlight the 1st, 10th, 25th, 50th, 75th, 90th, and 99th percentiles of the predicted risk distributions.

