
Figure 3.
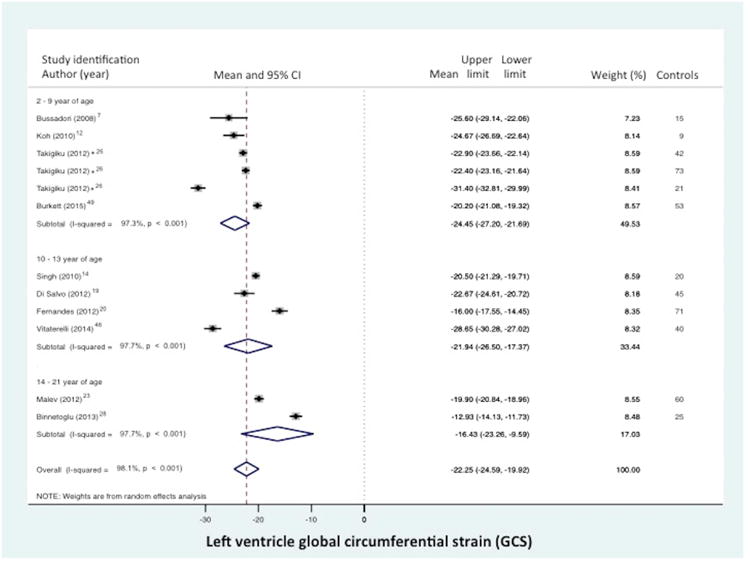
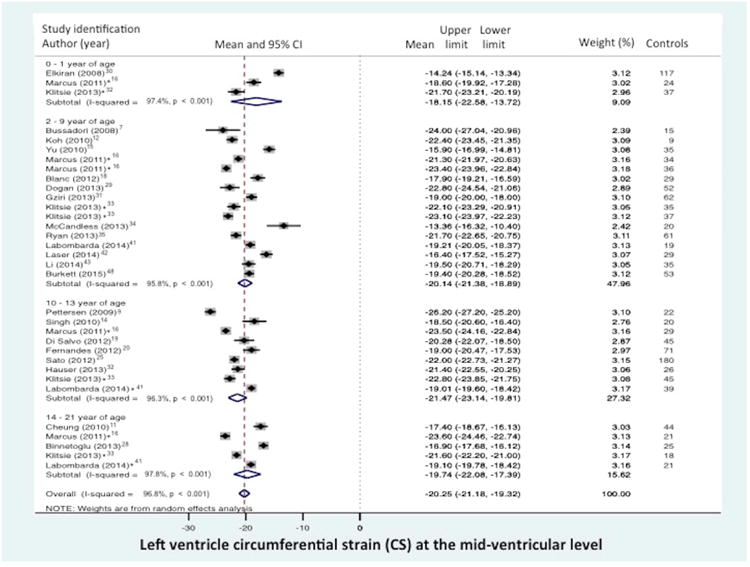
Normal value of LV global circumferential strain (GCS) stratified by age distribution and view. (A) LV “global” CS derived from the segmental averaging of the three short axis views at the base (mitral valve), mid-ventricular (papillary muscle), and apical levels views and (B) LV CS at the level of the papillary muscle only. The forest plot lists the names of the included studies by age distribution and in chronological order, the mean and confidence intervals with the upper (95%) and lower (5%) limits. Each study is represented by a square that reflects the mean at the point estimate of effect and is proportional to the study's weight in the meta-analysis. A horizontal line extending from either side of the square reflects the 95% confidence interval. The overall meta-analysis measure of effect is plotted as a diamond with the lateral points of the diamond indicating confidence intervals for this mean estimate.73 *Klitsie et al., Labombarda et al., Lorch et al., Marcus et al., Takayasu et al., and Takigiku et al. all performed a cross-sectional study and reported strain values for multiple mean age groups from birth to 21 years of age.8,16,17,26,33,41