
Figure 5.
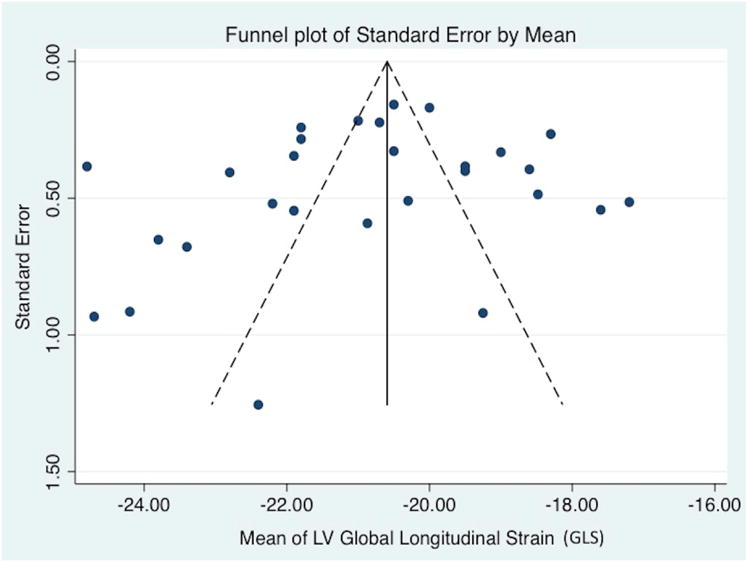
Publication bias. Funnel plot for studies of left ventricle global longitudinal strain. The standard error of the effect estimate is plotted on the vertical axis. The mean of the LV GLS is plotted on the horizontal axis. Visual inspection shows symmetry in the distribution of the studies that suggests the absence of publication bias (P=0.40 from the Egger test for statistical funnel plot symmetry.