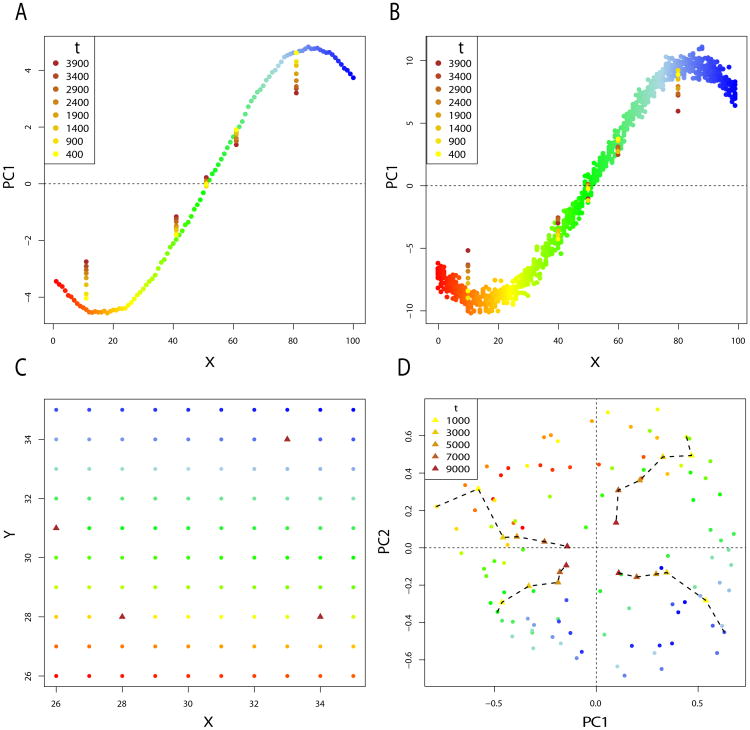
Figure 6.
Panel A. First principal component for the 1-Dimensional simulation, with m1 = .01 and m∞ = 4.10−5. PCA is performed on allele frequency data from each of the 100 demes, and ancient allele frequencies are taken in 5 populations at 8 times in the past. Panel B. First principal component for the 1-Dimensional simulation. In each deme, 10 diploid individuals are sampled at the present time. One diploid individual is sampled in 5 demes at 8 times in the past. Panel C. Sampling scheme of a 10 × 10 grid of populations. Demes marked by a triangle are demes where ancient individuals were sampled. Panel D. plot of PC1 and PC2 for the 2-Dimensional simulation with m1 = .001 and m∞ = 10−5. Ancient samples are taken at different times in the past for 4 demes.

