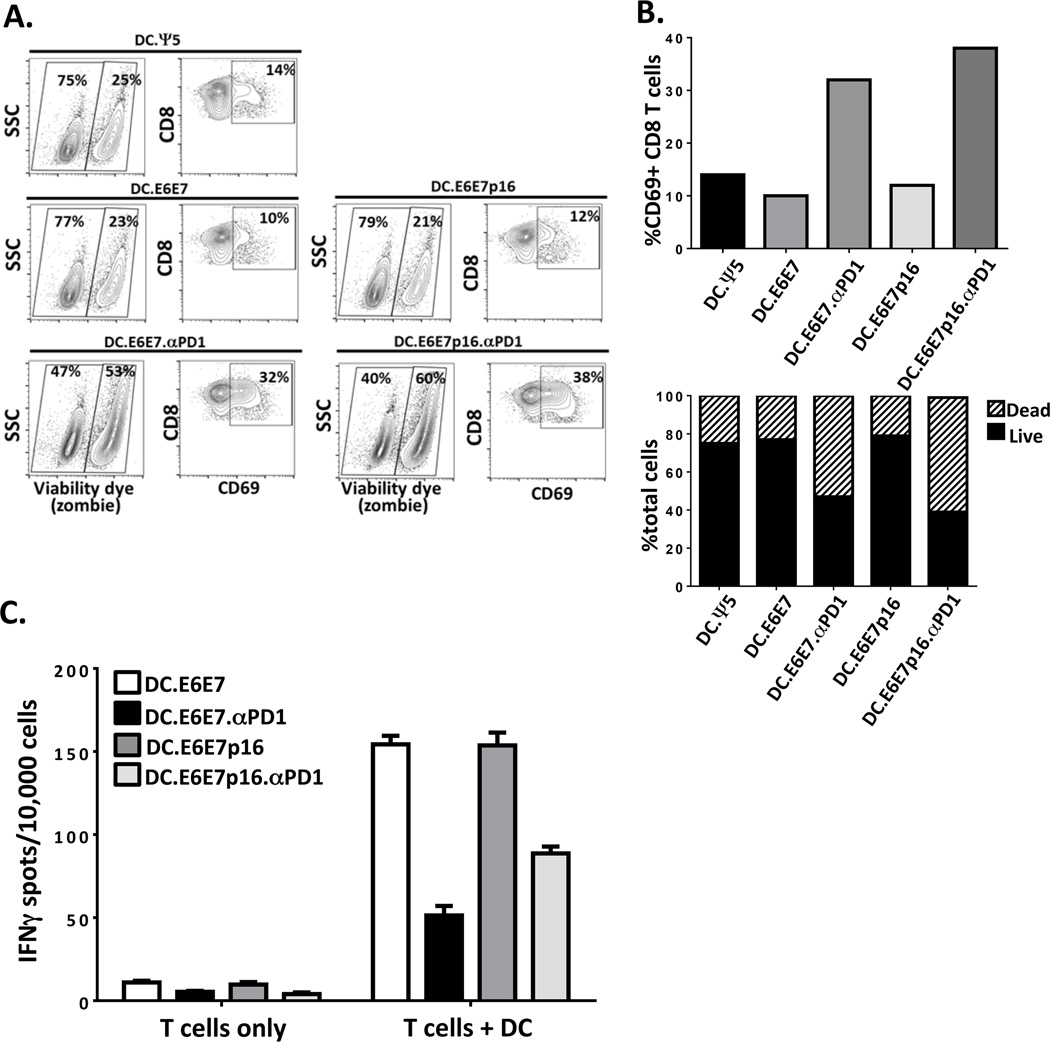
Figure 3. Increased activation and turnover of CD8+ T cells when expanded in the presence of Ad-αPD1 makes them less responsive upon re-stimulation with new adenovirus-infected DCs.
A) CD8+ T cells were stimulated for 12 days with either DC.Ψ5 or DC.E6E7 or DC.E6E7p16 in the presence or absence of Ad.αPD1. The percentage of dead/dying CD8+ T cells was determined by using an amine reactive dye (Live/Dead) and the activation status was evaluated by the expression of activation marker CD69. B) Graphical representation of the percent CD69+ T cells (left graph) and the proportion of live and dead cells on each condition (right graph). C) Graphical representation of ELISPOT assay depicting IFNγ secreting CD8+ T cells upon re-stimulation with new adenovirus-infected DC. The number of IFNγ secreting cells per 10,000 cells is shown. Results shown are of one representative donor.

