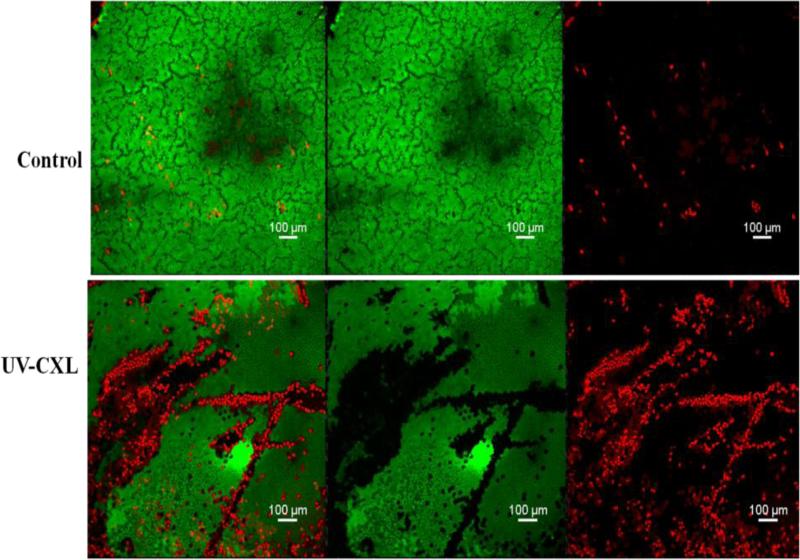
Figure 3.
Confocal micrographs (10×) of endothelium using calcein –AM (green, live) and ethidium homodimer-1 (red, dead) – stained corneas from control and CXL. The first two panels (top and bottom) show an overlay of dead (red) and green (live) cells. The middle two panels (top and bottom) show only green (live) cells. The right-most panels (top and bottom) show the dead (red) cells only. Areas of increased cell damage are shown in the CXL treated sample (three bottom panels).

