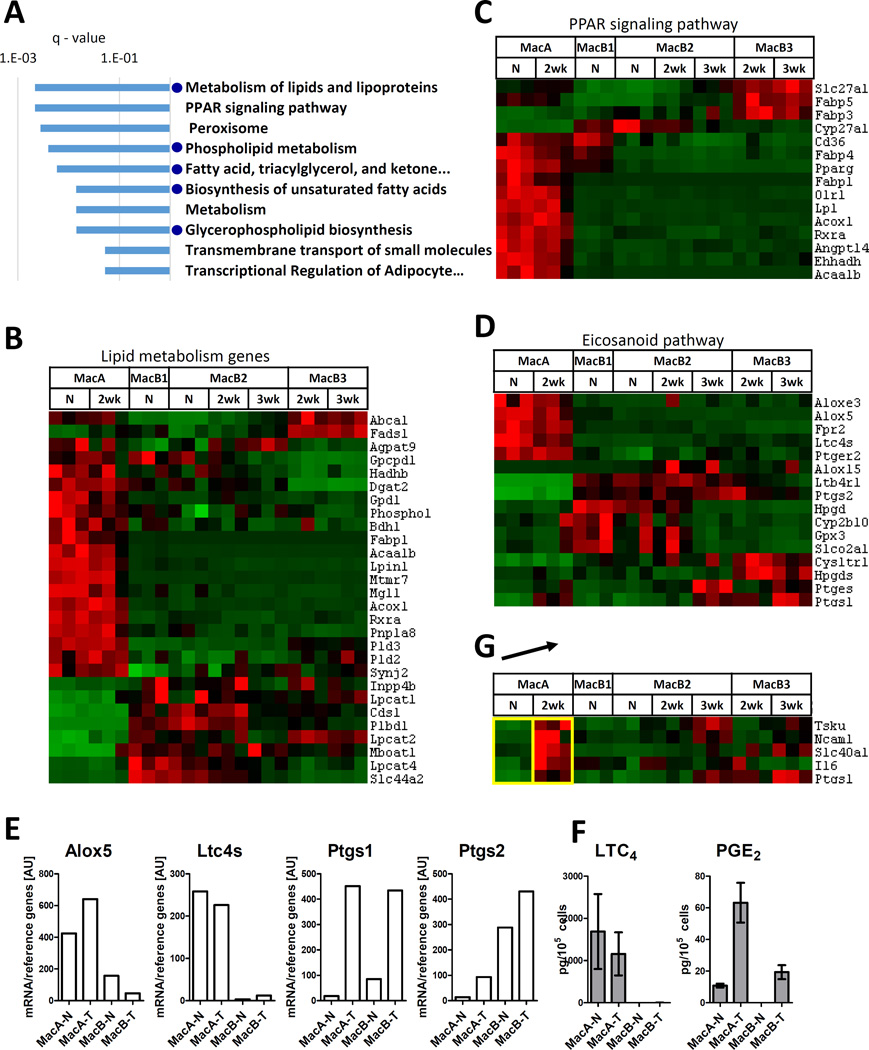
Fig. 4. Analysis of MacA cells.
(A) Top 10 KEGG/Rectome database pathways overrepresented in gene Cluster A (genes highly expressed in MacA-N and MacA-2wk cells). Blue dots indicate pathways related to lipid metabolism. (B) Levels of differentially expressed genes related to lipid metabolism. Gene list was based on consensus between the top ranking lipid metabolism pathways. (C) Levels of differentially expressed genes related to PPAR signaling. Gene list was based on the KEGG set “PPAR signaling pathway”. (D) Levels of differentially expressed genes in the eicosanoid pathway. The key leukotriene pathway enzymes (Alox5, Ltc4s) and prostaglandin pathway enzymes (Ptgs1, Ptgs2) are indicated. (E) Levels of mRNA of Alox5, Ltc4s, Ptgs1, Ptgs2. The cells were recovered form a separate group of mice, in which the MacB subpopulations were pooled, and mRNA was extracted and quantified by RT-qPCR. Levels were normalized to reference genes (geometric average of beta-actin, Gapdh, 18s and UbqC). (F) Production of LTC4 and PGE2 by MacA and MacB cells recovered by flow cytometry and stimulated in vitro with calcium ionophore (G). Genes upregulated in MacA-2wk compared to MacA-N. The arrow indicates the 2 populations being compared. Shown are only genes that met the differential expression criteria in this comparison, and whose average expression in MacA was higher than in the MacB populations.

