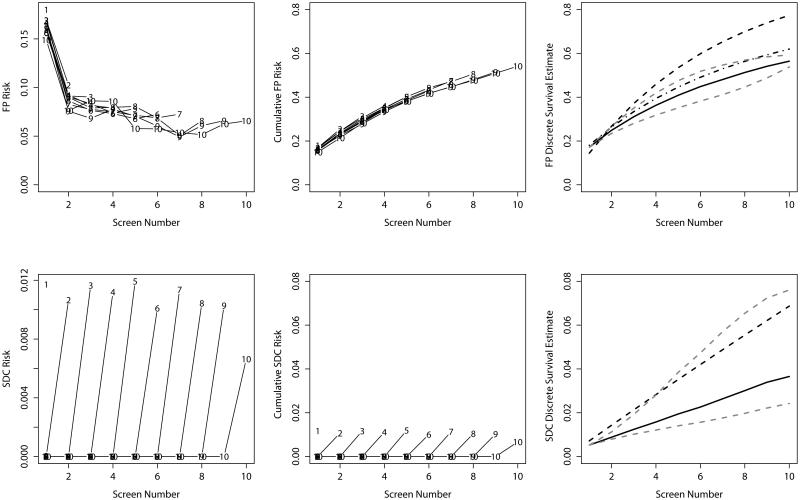
Figure 1.
Empirical risk estimates (left), empirical cumulative risk estimates (middle) and model-based risk estimates (right) for false-positive results (top) and screen-detected cancer (bottom) for the BCSC cohort. Lines in the left-hand and middle plots provide empirical risk estimates stratified by censoring time. Points on each line are labeled with the censoring time for the corresponding stratum. In the right-hand panel, the solid line gives the discrete-time survival estimate, the dashed line gives the discrete-time survival model adjusted for censoring round, the dashed and dotted line gives the discrete-time survival model adjusted for censoring round and screening round, and the dotted grey lines give the censoring bias estimates assuming 10% increased and decreased risk associated with each additional round attended.

