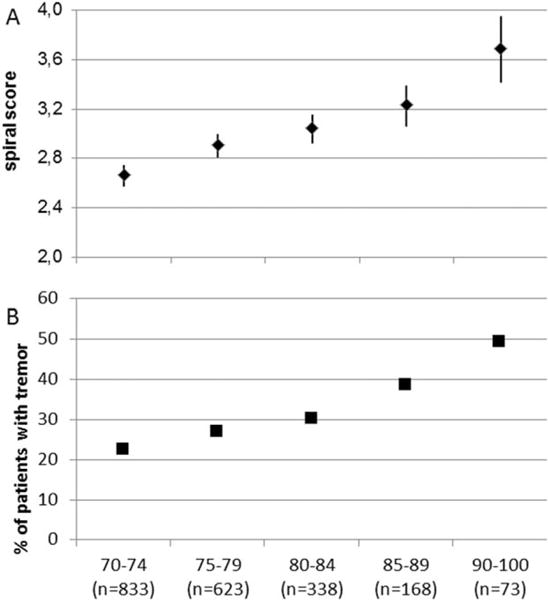
FIG. 1.

Spiral score severity and age. (A) Mean spiral scores for all subjects (men and women) with confidence limits according to age groups. The differences between all age groups are highly significant: P < 0.001). (B) Percentage of subjects with a spiral score of 4 or more, which can be considered symptomatic tremors. The percentage increases with each age group. This shows that the spiral score increases with age, and this is attributable to increasing numbers of patients with high spiral scores.
