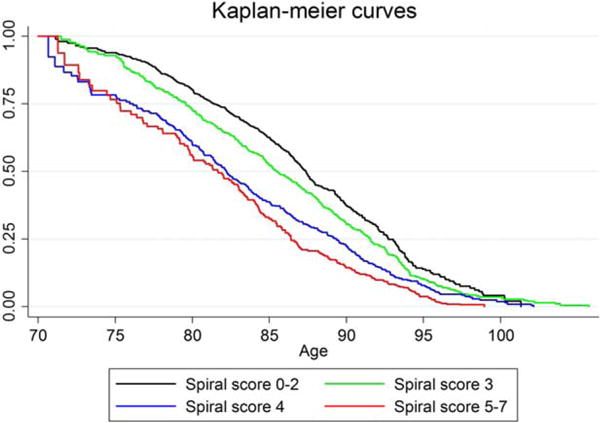
FIG. 2.

Kaplan-Meier curves for mortality in the whole cohort. Subjects with higher spiral scores have increased mortality. The reference population has a spiral score of 0 to 2 (n = 783 subjects). Subjects with a spiral score of 3 (n = 690), a score of 4 (n = 365), or 5–7 do have significantly worse hazard rations for mortality. All groups are significantly different at P < 0.01 from the reference population. This indicates that the survival of subjects is dependent on the tremor spiral score. The higher the tremor score is, the shorter is the life expectancy. Because this group is dominated by patients with aging-related tremor (ART), this shows that they have a shortened life expectancy. Instead of calculating the Kaplan-Meier curves, this also can be analyzed with hazard ratios for mortality. This shows the same result and is shown in Supplemental Data Table C.
