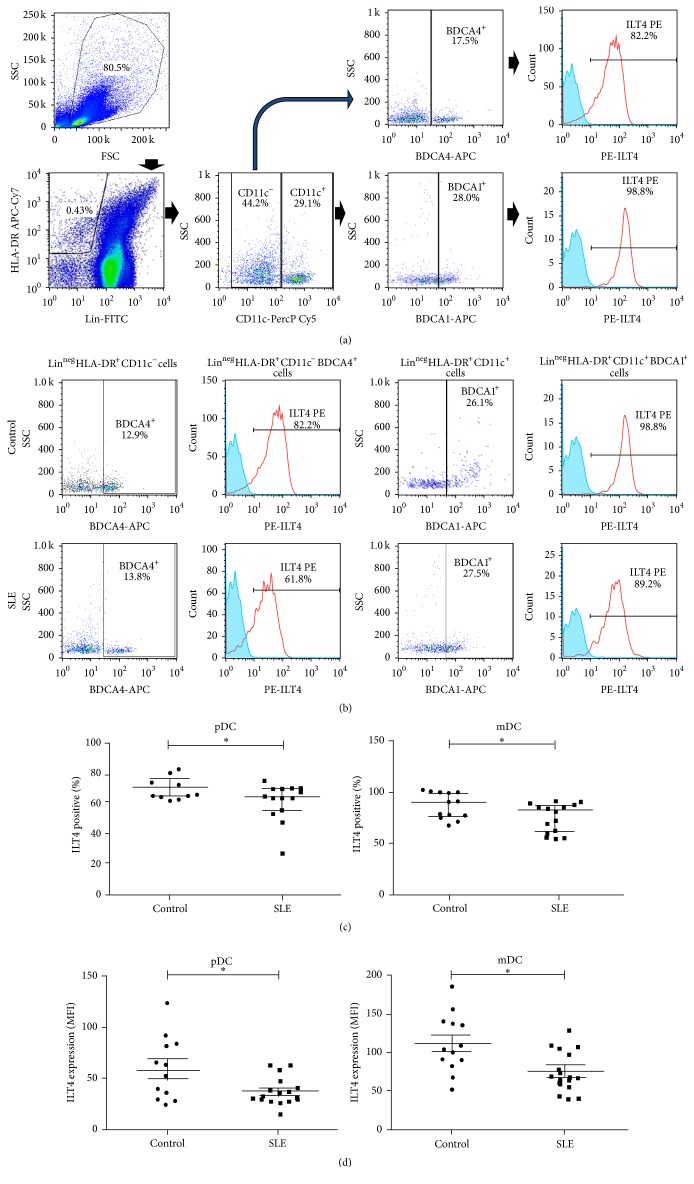
Figure 1.
Expression of ILT4 by DC in the peripheral blood from SLE patients and healthy controls. (a) Polychromatic flow cytometry gating tree for lineage-negative (Lin−), HLA-DR+, CD11c+, and BDCA1+ cells (mDC) and Lin−, HLA-DR+, CD11c−, and BDCA4+ cells (pDC). ILT4 positive cells were evaluated in each subpopulation. Data shown in (b) and (c) were generated based on this gating tree. Cut-offs for background fluorescence were based on isotype-matched Ig negative controls and FMO (Fluorescence Minus One) strategy. (b) PBMCs from SLE patients and healthy subjects included in the study were immunostained for the detection of ILT4 expression on pDC and mDC by flow cytometry, as stated in Section 2. Percentages of ILT4+ mDC or ILT4+ pDC were calculated for Lin−HLA−DR+CD11c+BDCA1+ or Lin−HLA−DR+CD11c−BDCA4+ cells, respectively. Representative histograms from cells of one control and one SLE patient (upper and lower panel, resp.) are shown. Numbers indicate the percentage of BDCA4+ cells from Lin−HLA-DR+CD11c− gate or BDCA1+ cells from Lin−HLA-DR+CD11c+ gate (first and third panels) and ILT4+ leukocytes from Lin−HLA-DR+CD11c−BDCA4+ or Lin−HLA-DR+CD11c+BDCA1+ gate (second and fourth panels). (c) Percentages of ILT4 positive pDC (left panel) and mDC (right panel) from SLE patients and healthy controls. ∗ p < 0.05. (d) MFI of ILT4 expression on pDC (left panel) and mDC (right panel).

