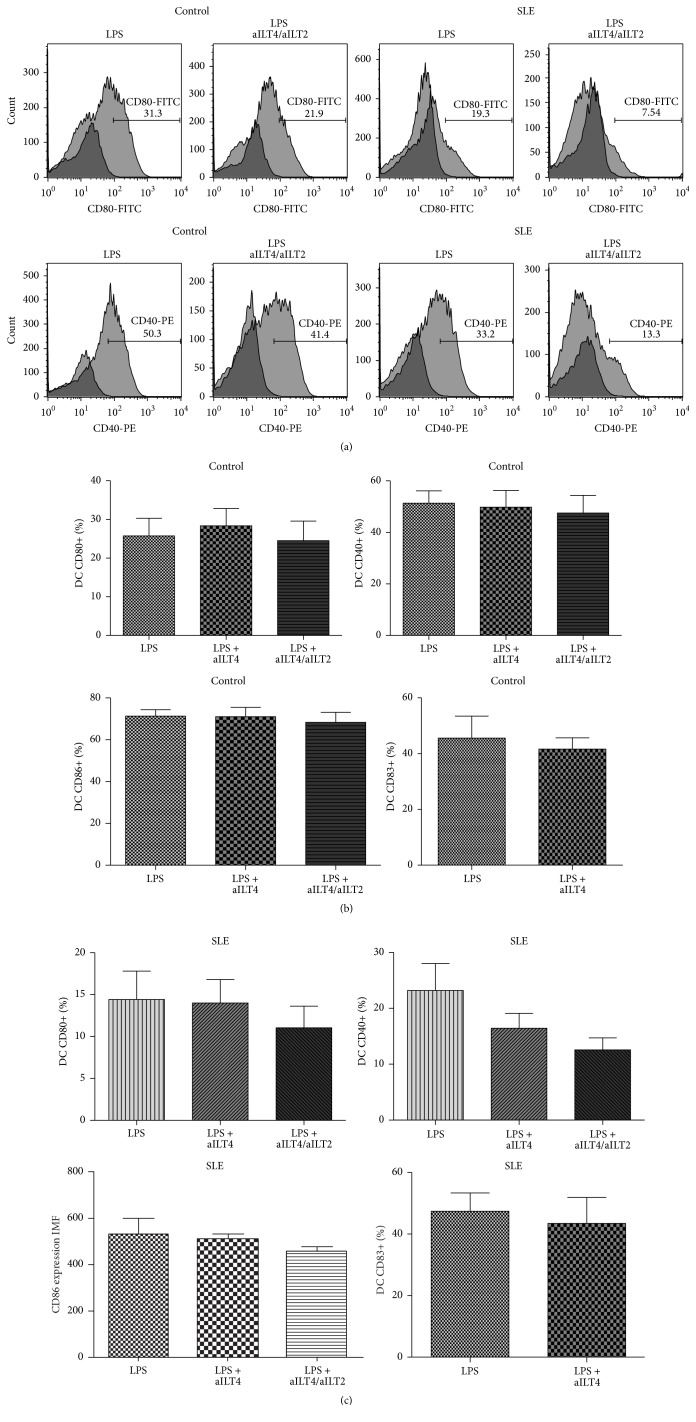
Figure 3.
Effect of ILT4 on the expression of costimulatory molecules by mature moDC from healthy controls and SLE patients. (a) Representative dot plots for the expression of CD80 and CD40 in healthy controls (left panel) and SLE patients (right panel). Numbers represent the percentage of CD80 and CD40 positive cells. (b) Analysis of the expression of maturation markers in mature DC from healthy controls and SLE patients, in response to continuous ligation of ILT4 or ILT4/ILT2. Results are represented as the median and the interquartile range.

