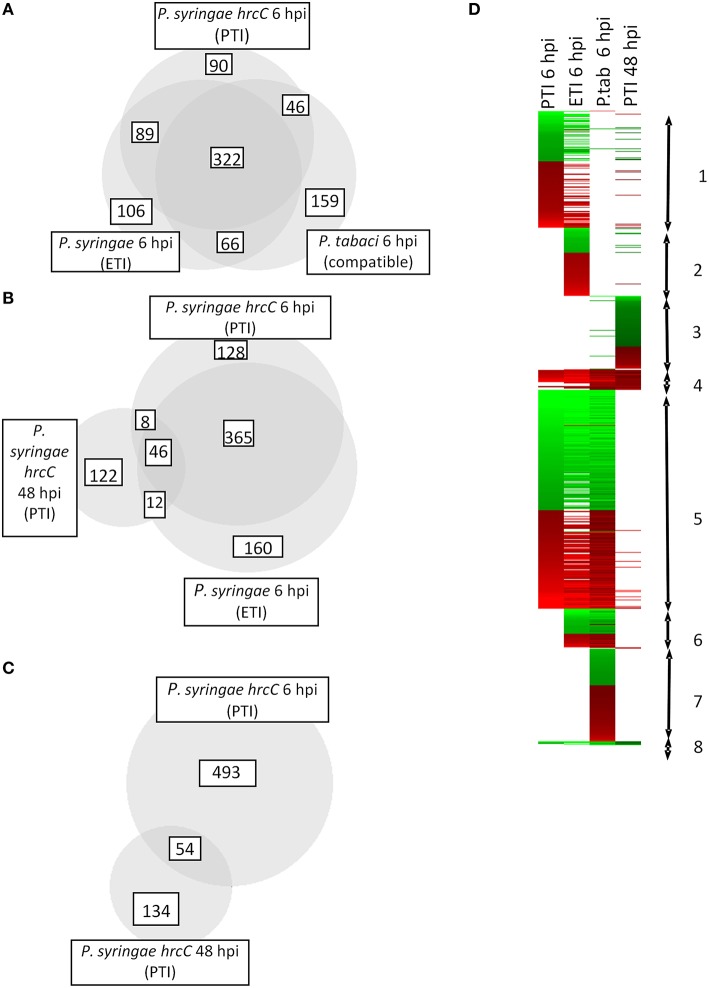
Figure 2.
Number and direction of expression changes induced by different bacterial treatments. (A–C) Number of common and specific genes significantly up- or down-regulated after inoculations. Area-proportional Venn diagrams were produced with help of BioVenn (Hulsen et al., 2008) (D) Cluster analysis of transcriptomic alterations induced by different bacterial treatments. Genes appearing in cluster 1 are affected mostly by PTI and ETI at 6 hpi. Some of the genes here are up- or down regulated exclusively during PTI at 6 hpi. Cluster 2 contains genes that are specific mainly to ETI at 6 hpi. Group 3 includes specific genes of late (48 hpi) PTI. Most of the genes belonging to cluster 4 were activated in all samples irrespective of the type of bacterial treatment. Cluster 5 represents genes that changed their transcription at 6 hpi regardless of the type of the treatment. Group 6 contains activated or repressed genes induced by living pathogens with functional Type III secretion system (either ETI inducible P. syringae or compatible P. tabaci). In cluster 7 there are genes whose transcription was specifically modulated by compatible disease causing P. tabaci. Genes belonging to cluster 8 were repressed in all samples irrespective of the type of bacterial treatment. Red and green colors represent up- or down regulation of genes compared to water infiltrated control, respectively.

