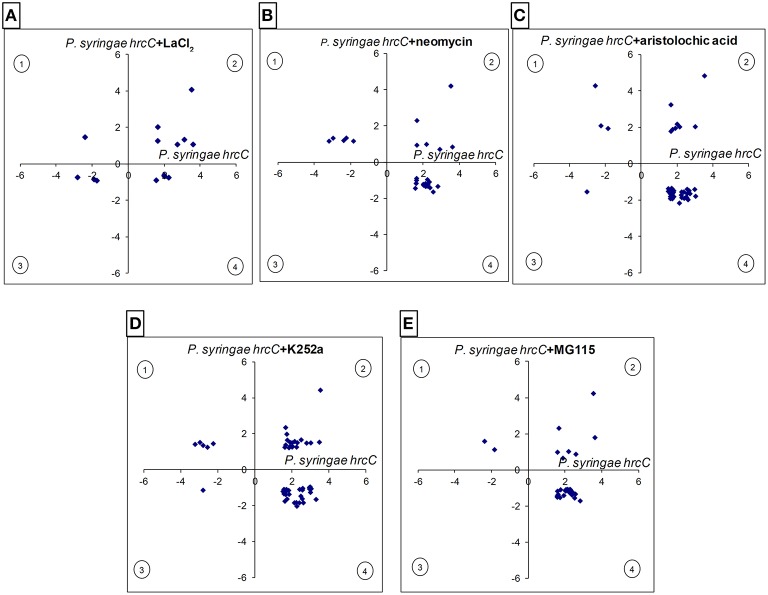
Figure 4.
Comparison of the intensity and directions of gene expression changes caused by various signal inhibitors on PTI-related genes at 6 hpi. X-axes show average log2 transcription activation or repression of PTI-related genes compared to water-injected control (up- or down-regulated in P. syringe hrcC infiltrated leaves). Y axes show changes caused by signal inhibitors on PTI-related genes (P. syringe hrcC+signal inhibitors) compared to P. syringe hrcC (PTI)-injected samples. (A) LaCl2, Ca2+ channel blocker (B) neomycin, phospholipase C/D inhibitor (C) aristolochic acid, phospholipase A inhibitor. (D) K252a, kinase inhibitor (E) MG115, proteasome inhibitor. Points in quadrants 2 and 3 show those genes activated and repressed in the same direction in both treatments, respectively. Points in quadrants 1 and 4 show those genes that were activated and repressed in the opposite direction in the two treatments. Figure shows results of the average of triplicates.

