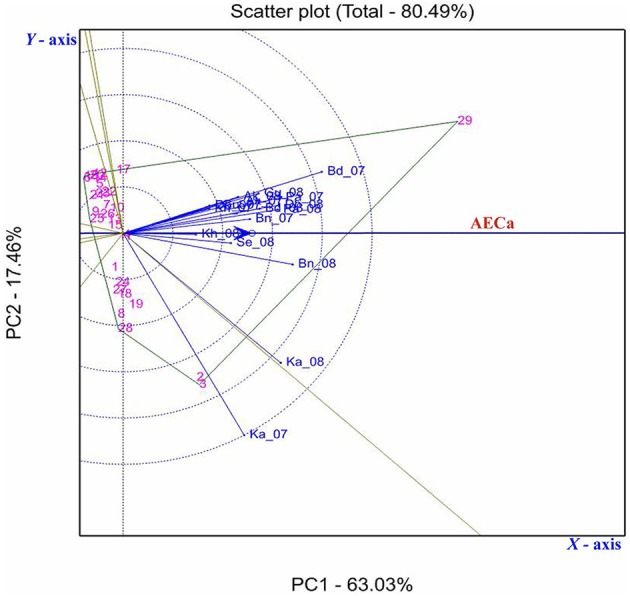
Figure 8.

GGE biplot showing the relationship among 18 environments based on Fusarium wilt incidence of 29 pigeonpea genotypes evaluated across nine locations in India. First and second principal components PC1 (wilt incidence) and PC2 (resistance stability) explained 63.03 and 17.46% of total variation. The environments are denoted by first two letters of the location followed by year (2007, 07; 2008, 08); vectors are as solid blue lines. Those genotypes contributing the most to the interaction delimit the vertices of a polygon comprising the rest of accessions. A perpendicular line was drawn to each side of the polygon, forming eight individual sectors.
