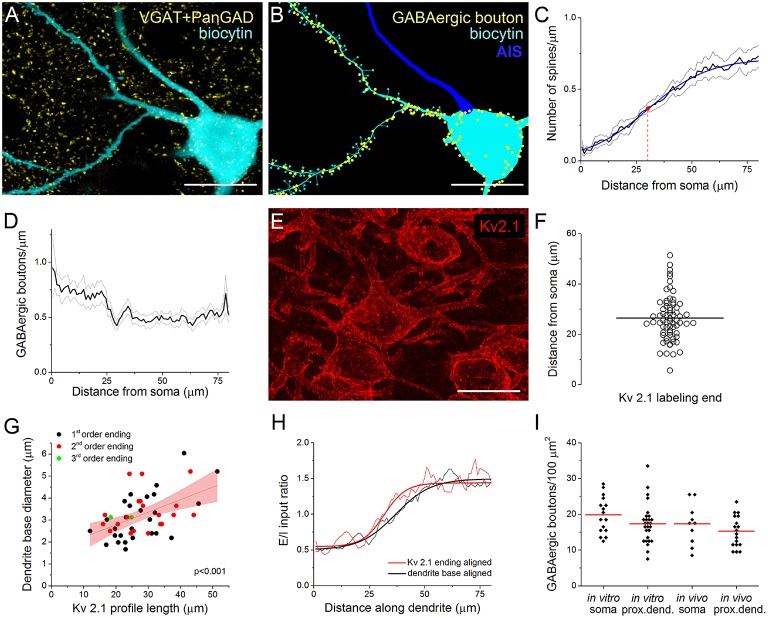
Figure 1.
Immunostaining against Kv2.1 channel protein visualizes the extent of the perisomatic region along the proximal dendrites of principal cells in the BLA, a functional domain receiving predominantly GABAergic inputs. (A) Maximum z-intensity projection image of a biocytin-filled principal cell (PC) in the BLA shown together with GABAergic boutons visualized with immunostaining against VGAT and PanGAD. (B) GABAergic boutons in close apposition with the same PC as in (A) are indicated in a Neurolucida reconstruction (AIS, axon initial segment). (C) Relationship between the spine number and the distance from the soma. A Boltzmann function (blue line) fitted onto the spine distribution gave an inflection point at 30.5 ± 0.85 μm (red dot). Pooled data obtained from 68 dendrites of 11 PCs. (D) The distribution of GABAergic boutons along the dendrites as a function of the distance from the soma (19 dendrites of 4 PCs). (E) Kv2.1 immunostaining in the BLA. (F) The variance in the length of Kv2.1-immunopositive dendrites is shown. Horizontal line indicates the mean of 26.43 μm (n = 68). (G) The length of the Kv2.1-labeling correlated with the diameter of biocytin-filled dendrites at their somatic origin, but it was independent from the dendritic branching pattern (i.e., the order of the dendrites). Red area indicates 95% confidence interval of the linear fit. (H) Excitatory and inhibitory (E/I) ratios on PCs calculated from data in (C, D) are shown aligned by the dendrite base or the end of Kv2.1-immunostained profiles. Note the steeper change in E/I ratio when aligned to the end of Kv2.1-immunolabeled dendrites (see text for details). (I) The density of GABAergic boutons on the PC somata and their Kv2.1-immunostained dendrites is similar when determined either in vitro and in vivo. (red lines: mean of the distributions). Scale bars, 20 μm in (A, B, E).

