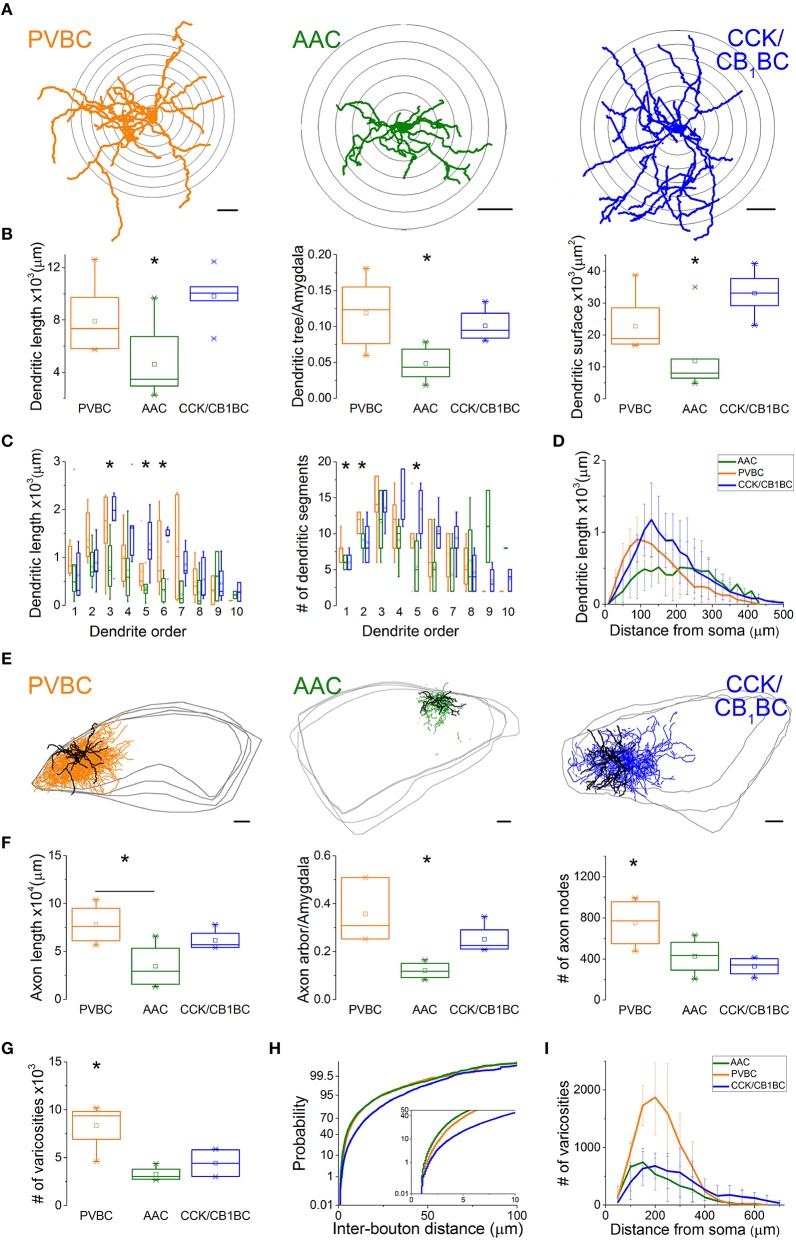
Figure 5.
Dendritic and axonal arborization of the three perisomatic region-targeting interneurons are distinct. (A) Neurolucida reconstructions of the dendritic arbor of three example cells labeled in slice preparations. Concentric circles drawn on the reconstructions illustrate the radii used for Sholl Analysis. (B) Box chart comparison of total dendritic length, the ratio of the extent of the dendritic tree and the amygdala within the slices, and total dendritic surface. The mean (small open square), the median (midline of the box), the interquartile range (box), and the 5/95% values (ends of whisker bars) are plotted. (C) Comparison of the dendritic length and the number of dendritic segments as a function of dendritic order. (D) Dendritic length as a function of distance from the soma. (E) Neurolucida reconstructions of the biocytin-filled processes (dendrites in black, axon in color) of the same interneurons as in (A). The borders of the amygdala are shown in gray. (F) Box chart comparison of total axon length, the ratio of the extent of the axon arbor and the amygdala within the slices, and the number of axon nodes. Box and whiskers as panel (B). (G) Comparison of the number of varicosities on axon collaterals. Box and whiskers as panel (B). (H) Cumulative probability distributions of the inter-bouton distances for the three cell types. The initial 10 μm of the distribution is enlarged in the inset. (I) Number of varicosities as a function of soma distance. For more details, see Table 2. All scale bars are 100 μm. *indicates significant differences.

