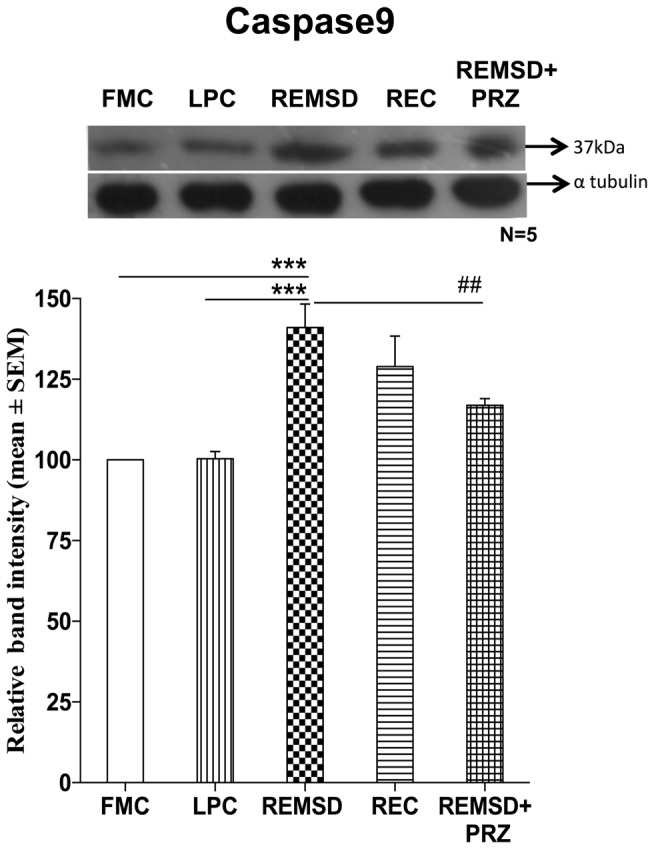
Figure 5.

Caspase9 expression in the brain homogenate of rats under different conditions. Upper panel shows a representative Western blot of caspase9. Histogram in the lower panel shows percent changes in the mean (±SEM) band densities of the blots as compared to FMC taken as 100% in five sets of experiments. Abbreviations are as in the text. Significance levels are between the treatments of connecting horizontal bars; ***p < 0.001 and ##p < 0.01, * as compared to FMC and # as compared to REMSD.
