


Figure 2.
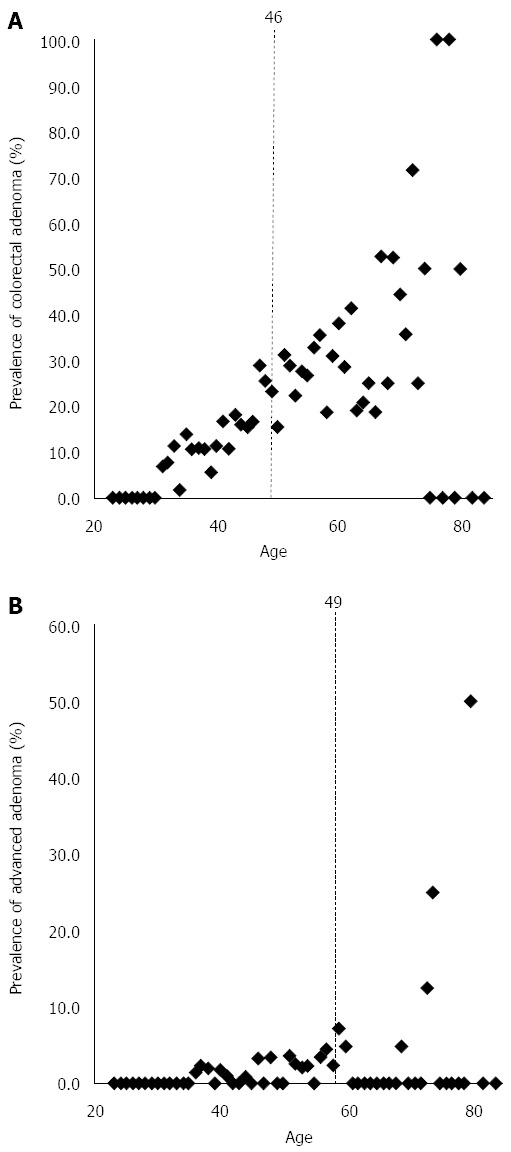
Hierachial cluster analysis. Scatter plot shows relationships among the age and incidence of adenoma. A and B indicates the age and incidence of colorectal adenoma and advanced adenoma, respectively. Red broken lines indicate demarcations from cluster analysis.