Figure 2.

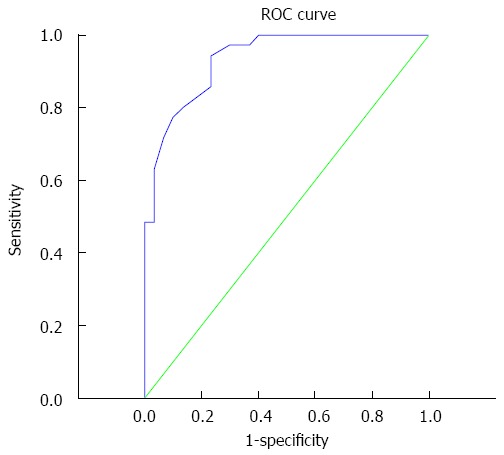
Receiver operating characteristic curve. Area under the curve is 0.934, the optimal diagnostic point is 1.14 × 10⁻³ mm2/s, and sensitivity and specificity are 94.3% and 76.7%, respectively.

Receiver operating characteristic curve. Area under the curve is 0.934, the optimal diagnostic point is 1.14 × 10⁻³ mm2/s, and sensitivity and specificity are 94.3% and 76.7%, respectively.